Topic Contents: Hide
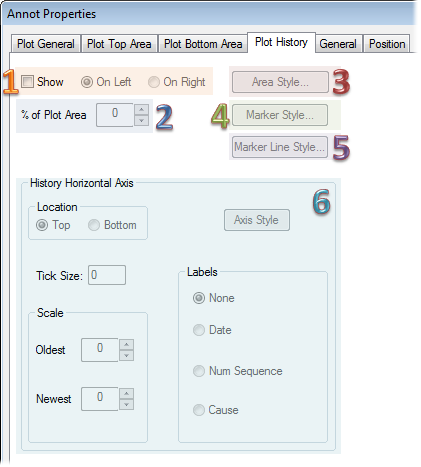
Enable Show to display the Plot History.
Set the percentage of the plot area that you want to use to display the plot history.
Area style allows you to control the plot space area background and border properties. See the topic Style Properties for more information.
Set a style for the Markers in the Plot History.
Set a style for the lines connecting the markers (series markers) in the Plot History.
· Location - Indicate the desired axis location for the History Horizontal axis, top or bottom.
· Tick Size - The tick size is the size of the hash marks that comes off of the Horizontal Axis and marks the position for the corresponding labels.
· Scale - The historical horizontal scale defines the date range for the history you want to display in the chart. Select the number of Oldest and/or Newest historical axes you want to display.
· Axis Style - Axis style allows you to alter axis line and font properties. See the topic Style Properties for more information.
· Labels - Indicate the desired type of axis labels.