 ) button.
If you would like to view the Info bar, click the Toggle Info Bar () button.
The information bar has two tabs. The first is the Trace tab. It displays information about all the actions which CM4D has taken to accomplish displaying or creating a document. This will list where and when files were retrieved, refreshed, etc.
The other tab is the Grid. Right-click in the DataSource tab and select View in Grid from the menu. This will display various feature and sample data information in a table format.
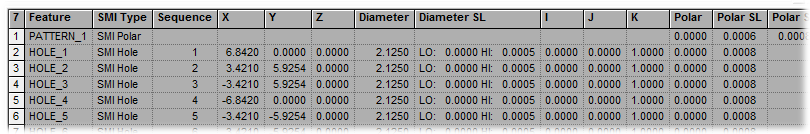
From the DataSource tab of the tree bar, right-click on Features and select View Features in Grid from the menu. This will display a single row in the grid for every feature in the selected routine. All available nominal information about the features will appear in the same row, including the feature label, aliases, SMI feature type, nominals, and tolerances.
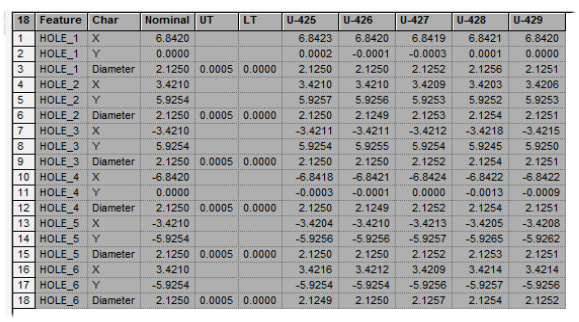
In the DataSource tab, right-click Samples and select View Samples in Grid from the menu. As with features, each row of the grid will contain a single characteristic rather than having multiple characteristics (such as x, y, and z) for the same point in a single row. Samples marked with a " d" are deviations rather than actual values.
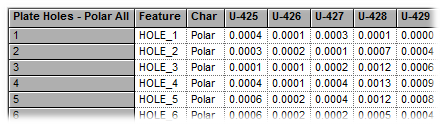
From the DataSets tab of the tree bar, right click on a DataSet and select View DataSet in Grid. This will show each row in the order it will appear when creating annotation with the DataSet. The grid will display data for the DataSets label, characteristic type, and samples.
If Single Sift Rules are being used, your data will appear as it normally would when viewed in the Grid. However, when Multiple Sift Rules are turned on, the data that appears in the grid changes to reflect the sifting criteria set in the Multi Sift Rules dialogs.
For example, when using Single Sift Rules, only "X's for Holes" may be shown. However, using Multiple Sift Rules allows you to set conditions such as, "show all X's for Holes, but first show all Y values <200, then all Y values [ (less than or equal to) 400." With conditions set, the grid will show all available points that match that criteria in black text. Rows that contain characteristics that do not match set criteria will appear gray, indicating inactive rows in the DataSet. These gray rows are characteristics that are available (the data does exist), but will not be used in annotation because those characteristics do not meet the Multi Sift criteria.
When a DataSet with Multiple Sifts turned on is displayed in the grid, an extra column is added. This column, Map, indicates the order of rows in the sifted DataSet. A # sign next to the values in the grid signifies that a cause has been assigned to them.
Please refer to the Sift Rules section of the DataSet properties topic for more information on Sift Rule settings.