Metrics and Monitoring
The performance and health of the entire CM4D Automation Services can
be tracked and analyzed with external reports by manually querying the
CM4D Site Database.
 Notice
At
this time the CM4D Metrics and Monitoring system does not provide a way
to consume (use) the information stored in the database. It is intended
that the end user will use their preferred method for querying the database
to retrieve the relevant data. Tools such as Microsoft's SQL Server Reporting
Services (SSRS) could be utilized to retrieve such information and collate
reports.
The Site database collects Metrics
(information about health and performance) pertaining to the automation
system, and Monitors and records
information about the current jobs handled by the automated services.
The automation services include DataSmithBatch, CM4D Scheduler, and CM4D Launcher. To turn
on the Metrics and Monitoring, you must have the Site
Database Administrator privilege in SiteManager.
Metrics
The automation services creates records in the Site database when the
following actions occur:
· A component is Started,
Still Running (checked periodically), or Shut Down.
· DataSmithBatch Job Started,
or Completed
· Scheduler Job Queued, Started,
or Completed
· Scheduler Client Job Received
· Report Generated
· Scheduler Client Launched
or Shut Down
Monitoring
The services can be also checked on a timed basis, to see what the current
workload of each user and service.
· Scheduler Job Queue
Notice
As
of now, only the Scheduler Job Queue can be monitored. Monitoring for
other services is intended to be added in a future release.
Site
Manager - Enterprise Profile Settings
To turn on Metrics and Monitoring, run Site Manager and log in. Open
the menu Settings>Enterprise Profile
Settings.
Enable Metrics and Monitoring
This check box turns on Metrics and Monitoring for the entire system.
Any databases and users across a network that are controlled by the instance
of Site Manager that has this enabled will be begin to send messages to
the site database and have their services monitored.
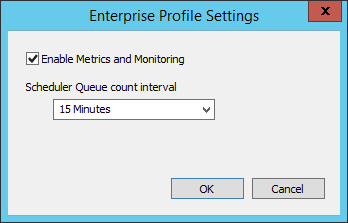
Scheduler Queue Count Interval
The Scheduler Queue count interval is how often the Scheduler Job
Queue is checked to record which Job
Users are using an active Scheduler and the number of jobs each user
is running. This count can be done from 15 minutes to 24 Hour intervals.
This counted information can be retrieved from the M2Count
database table.
Notice
Changes
made in the Enterprise Profile Settings dialog will take effect as soon
as you click OK. You do not need
to Save in the main SiteManager interface. If you click Exit,
any changes to the profile settings will still take effect.
Metrics Database Tables
See the topic Metrics
Database Tables for detailed Administrative information the database
tables used by the Metrics and Monitoring system.