Topic Contents: Hide
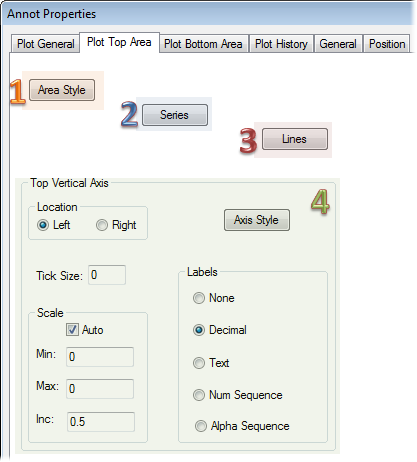
Area style allows you to control the plot space area background and border properties. See the topic Style Properties for more information.
In the Chart Plot Space dialog, selecting the Lines button allows you to add or modify chart lines. There are many different types of lines that you can add to your chart.
See the topic Chart Series.
See the topic Chart Lines.
· Location - Indicate the desired axis location for the top vertical axis, left or right.
· Tick Size - The tick size is the size of the hash marks that comes off of the Vertical Axis and marks the position for the corresponding labels.
· Scale - The top vertical axis scale defines the vertical value range for the top area of the chart. This range is typically set to cover most of the values that will be plotted. Select the auto check box to have scales computed automatically by the chart. The chart will auto scale to fit all of the feature values being plotted from the charts data source. To provide your own scales, clear the check box and provide the minimum and maximum scales desired. Scales with too large or too small a range may produce undesired results.
· Axis Style - Axis style allows you to alter axis line and font properties. See the topic Style Properties for more information.
· Labels - Indicate the desired type of vertical axis labels. Currently both Text and Decimal labels produce the same results for vertical axes. The labels will be the scale value for the label interval position on the axis.