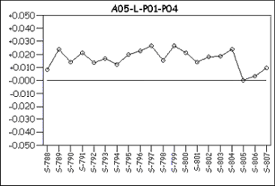
Charts are very versatile instruments which allow you to display measured, designed, and statistical feature information. CM4D has three main chart types: trend charts, control charts, and feature comparison charts.

A Chart annotation can be created with the Chart
( ) tool
or by selecting Annotation in the menu bar, then selecting Chart.
You must have a DataSet to use the chart annotation. If you already have a DataSet created that you want to use for this chart, you can select it by accessing the charts properties and selecting the DataSource tab within the properties dialog. Within this dialog, select the desired DataSet from the menu in the DataSet selection. Under this menu you have the option to select which row of the DataSet you want to use. The chart will then be populated with the data from just that line. If you choose not to specify a line, the chart will be populated with all of the features within the DataSet.
If you do not have a DataSet created you will need to create one. See the topic DataSet Tree for information on creating and modifying DataSets.