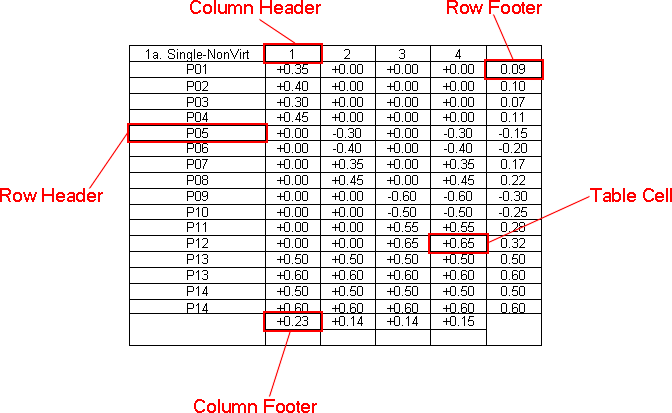
Tables allow for the display of information organized in rows and columns. At the intersection of each table row and column is a table cell. The top most row of cells is reserved for column headings and the left most column of cells is reserved for row headings. One or more footers can be added to a row or column in a table annotation using the Show DataSet Setup Table Properties dialog. The remaining cells can be edited to display any feature information.

When certain variables used in table cells resolve to more than one value, the table will automatically expand. This means that a new row (or column) will be added beneath the original cell for each resolved value. Certain variables, however, do not use table expansion, such as ~cause,sample~.
To
create a Table annotation, use the Table ( ) tool or
the New part of the Annotation menu.
Select the Table Tool. Your mouse pointer will change to look like the table tool. Choose the location on the sheet where you would like your table and click there. A default sized table will appear.
Select the table and press the delete key or right click within the table’s box and select the Delete option from the menu. Multiple annotation can be selected for deletion by holding the shift key and clicking the left mouse button on each.