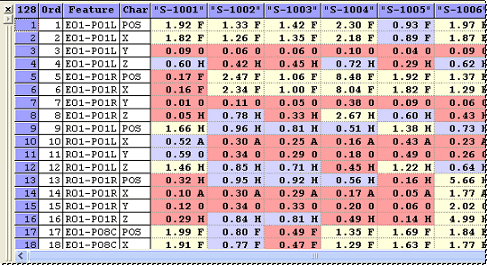
The DataSet Grid displays all of the features and samples within the DataSet in the selected query. There are several functions you can use that sort, remove, and filter the features within the DataSet.
In the DataSet grid, the cells which contain samples will turn a color, depending on the following conditions:
· Red - Data cells identified as "out" by the Event Trigger 1 settings in the DataSet.
· Yellow - Data cells identified as "out" by the Event Trigger 2 settings in the DataSet.
· Green - Data cells identified as "in" by either of the Event Triggers' settings in the DataSet.
· Blue - Data cells identified as "out" by both the Event Trigger 1 and Event Trigger 2 settings in the DataSet.
· White - Data cells contain data with an "undetermined" status. For example, a cell is considered "out" according to the event trigger settings of the DataSet, but there is no tolerance assigned to the particular characteristic. A cell could also turn white if there is either no data or no event set up in the DataSet.

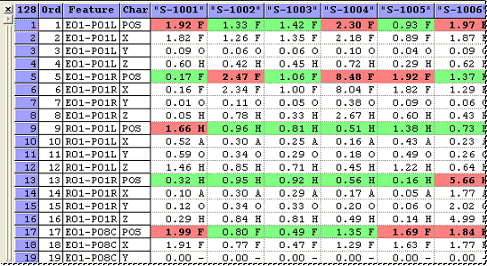
The DataSet grid will also display letters or symbols in the cells which represent the direction of a feature's tolerance, such as +, -, H, L, F, B, etc.
The spec limits of multiple features can be edited simultaneously using the Create/Edit Limits function. The edit operation will apply only to the features of the selected row(s) in the blue grid. Follow the steps below to use this function:
1. Select at least one row of the DataSet grid. The Create/Edit Limits option will not be available in the menu if no data has been highlighted.
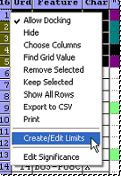
2. Right-click somewhere on the selected rows and choose Create/Edit Limits from the menu.
3. The characteristic type will be deactivated in the Create/Edit Limits dialog.
4. Populate the three control limit menus.

5. Populate the two value type fields if the value types are equal for all selected rows in the DataSet grid.

6. Use the latest process baseline (assume that the most recent process baseline is currently displayed in the DataSet grid).
7. When the Feature Editor is closed, a message will appear cautioning that changes will apply to all selected rows of the DataSet grid and will be committed immediately. Click Yes to proceed; click No to cancel and none of the changes will be committed to the Database.

Double clicking a column heading will sort the features alphabetically or numerically by the information within that column.
There are a couple ways to remove unwanted
features from the DataSet. The first is to select the features you want
removed, then clicking the remove
button ( )
on the view toolbar. The next way would be to select the features you
want to keep then click the keep
selected button (
 ) on the view toolbar. Holding
the Ctrl button allows selection of multiple features, holding the shift
button allows selection of a list of features.
 Tip
Tip
The options to Remove Selected and
Keep Selected can also be accessed through the View. See the topic
Views in CM4Di for more information.
To return all of the features and samples
within the query to the DataSet grid, click within the DataSet grid, then
click the show all
button ( )on
the view toolbar. All of the features and samples will be returned to
the grid.
 Tip
Tip
The option to Show All can also be
accessed through the View. See the
topic Views in CM4Di for more information.
When CM4Di is started, the grids will be empty.
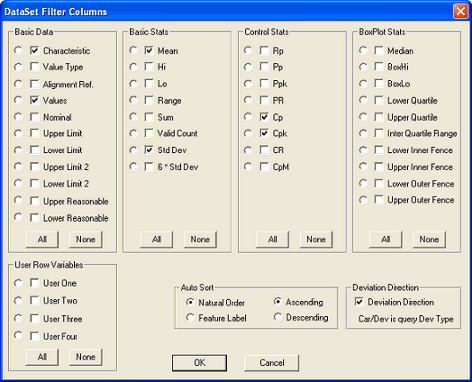
After loading data and selecting a report type, the columns of the grids
will display data. You can choose which columns you would like displayed
with the DataSet Filter Columns dialog. To open the DataSet Filter Columns
dialog, right click the double bar on the left side of the DataSet Grid,
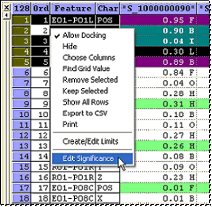
then select Choose Columns from the menu or click the Choose Columns ( ) button in the iView toolbar.
To display individual columns, select the check box next to the column.
To select all of the columns in a section click All. To clear all of the
check boxes in a section, click the None button.
Under Auto Sort, selecting Natural Order will load and display the rows of the DataSet Grid as they exist in the database. If you have Sift Rules set, however, the sorting options set in those Sift Rules will be used to determine sorting. Selecting Feature Label as the Auto Sort method will sort the contents alphabetically by the feature label and any existing Sift Rules will be overridden. Additionally, the rows of the DataSet Grid can be sorted in ascending or descending order. Selecting a radio button next to one of the columns will sort the rows of the grid by the contents of that column.
 Reference
For more information on using
Sift Rules, see
the CM4D Classic Help
Documentation.
To export one of the grids to CSV (Comma Separated Value), right click the side bar of the grid, then select Export to CSV. The Export Data dialog will appear. Browse to a location where you would like to save the file. Click Setup Print Header/Footer to open the Print Grid Setup dialog.