 the Grouping/List Options region. Select the Enable Grouping radio button.
The following steps will guide you through viewing data using DataUtility. This example will demonstrate standard sample viewing.
1. After Searching for Data, use the Data Viewing Options to customize the column organization and sorting of the features in the report display dialog.
2. In the Data Viewing pane, expand the Grouping/List Options region. Select the Enable Grouping radio button.
3. Click and drag the Routine column into the grouping header region of the display. There were two routines found in this example, the Decklid Assembly routine and the Decklid OTR routine, so those routines will determine the grouping structure of the report.
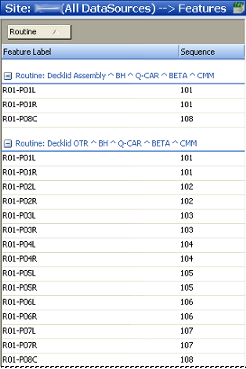
4. The features will be reported as two groups in this case: one group of features belonging to the Decklid Assembly routine, and another group of features belonging to the Decklid OTR routine.
5. Result data can be further sorted for quicker viewing using the Text Filter.
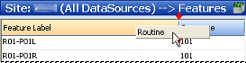
6. Return to List Mode by clicking the List Mode radio button in the Data Viewing window.
7. Click on the Routine header in the Columns field, then drag and drop it onto the report display header region.
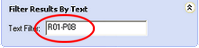
8. Expand () the Text Filter region and enter the label of a specific feature. This example uses the text 'R01-P08'.
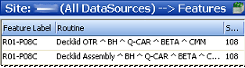
9. DataUtility will remove the features from the report that do not match the filter text. In this case, two features remain in the report display (one is from the Decklid Assembly routine, and the other is from the Decklid OTR routine).
10. Another way to reduce the amount of data viewed in the display region can be accessed by selecting multiple rows (using either the Shift key or Ctrl key). Right click on your selection, and choose Keep Selected Rows from the context menu. Only the rows that you selected will remain in the display region.
11. Now that you have formatted the report display to organize the data, you can delete the remaining features from the DataSource.