CM4D provides many tools to aid in monitoring your process for statistical process control. Control charts used in conjunction with control limits and process statistics provide an effective means of detecting problems or areas requiring adjustment.
In order to allow for differences in the way CM4D is used, it is important that the proper Statistics Rules are selected in the Document Defaults properties dialog. For the differences in how CM4D operates under the different Statistics Rules, see the Statistics Rules section of this manual.
Control Limits cannot be recalculated by picking a date.
Control Limits
Control Limits are limits that are used to determine if a process is in statistical control. CM4D will flag processes as out-of-control when established control limits are exceeded (see also Acceptance Control Limits). In general, CM4D provides the tools to set and maintain control limits and leaves it up to the user as to how and when to provide or update control limits.
CM4D provides several methods to create and maintain control limits. You must decide which method best suits your needs:
Manual creation, either from the Feature Editor or through DataSmith. With this method, the user determines the control limits and provides them manually to CM4D. CM4D will store the provided control limits in the CM4D database for use wherever the CM4D database data is referenced.
Use the CM4D initialization file (cm4d.ini) to specify control limits as a percentage of tolerance. For example, the CM4D initialization setting "[defaults] defaultcontrollimit = 75" will set the default control limits at 75% of tolerance. Default control limits will only be applied when no other control limits are available and may be used in conjunction with the other two methods.
Have CM4D calculate control limits using the Process Control Editor. This method uses standard statistical equations to calculate control limits on a provided set of data.
Process Control Editor
If the Process Control Editor is used to create or update control limits, only one type of control limit can be created for a selected set of data. When using the Process Control Editor, you must first create and populate a DataSet with the data that will be used for the control limit calculations.
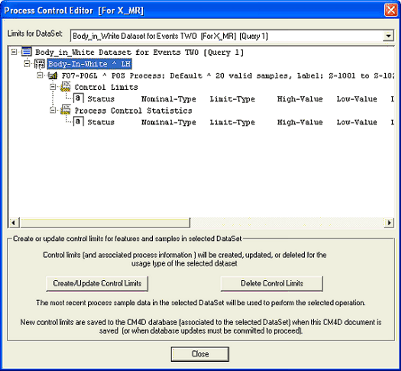
The selected DataSet must have a Usage Type property selected that is appropriate for use with control limits. The allowable usage types are X-MR, MA-MR, XBar-R, and XBar-S. The Process Control Editor will create or update control limits only for the usage type of the selected DataSet.
CM4D maintains control limits and process control statistical information separately for each usage type.
Control Limits and Stats Rules
The Process Control Editor will create control limits differently based on which statistical rules mode is in effect. For all modes, the Process Control Editor will operate only with data in the current process of each row and will never alter any other processes data.
Ford Statistical Rules
When a Control Limit is created with Ford Stat Rules active, the current process of each row of the DataSet is checked to see if it complies with the rule of 30 valid individuals or 20 valid subgroups based on the usage type. If any row does not meet the criteria of 30 valid individuals or 20 valid subgroups, control limits will not be created or updated for those rows.
If more than the 30 individuals or 20 subgroups of data are present, the data is restricted to the first encountered minimum required set of data (30 individuals or 20 subgroups) for the control limit type.
The minimum set of data is next checked for normality. If the data is abnormal, CM4D provides an option to hunt for the best normal minimum set of data among the provided data. This is done on a row by row basis, and separate rows may select different sample sets. Normality is determined using both the Correlation Coefficient and D'Agostino normality methods. However, comparisons for the best set of data use the Correlation Coefficient result. If a normal set (or better set) of data is found, it is selected as the minimum set of data to use.
If no hunting was selected, the original set of data is selected as a minimum set of data to use. If any rows have abnormal data at this point, an option is provided to transform the abnormal minimum sets of data to attempt to normalize the data.
In the transformation process CM4D may create one or more process transforms that are stored along with the control limits. Transforms will be created only for data that is found to be abnormal. If a suitable transform is found, CM4D will continue and calculate control limits with the transformed data. Process control statistics will also be calculated with the transformed data. However, the individual transformed data itself is never stored in the database and is never used to alter the individual data values in the database.
A provided DataSet may contain many rows for many different features and characteristics, and CM4D treats each row individually in regard to the above normality, hunting, and transform checks. The Feature Editor will list which transform type was used, if any, and may also be used to delete any undesired process transforms.
Before completing the creation or update of control limits, the selected minimum sets of data are checked for being in control. If any rows are Out-of-Control, the user is presented with the option to cancel or to continue anyway. If the user chooses to continue, the control limits are committed to CM4D's memory and saved to the CM4D database when the document is saved or the user otherwise explicitly or implicitly causes the database to be updated.
All Other Statistical Rules
For all other statistics rules modes, only minimum required points or subgroups are checked. CM4D will not create or update control limits unless it has the minimum required data. For SAAB, this is 10 points and 3 subgroups. For all others, there is no minimum. CM4D will use all of the data provided in the current process to calculate control limits.
Create/Update Control Limits
Select a feature which does not already have a limit. Enter a limit for the feature. Click Create /Update Control Limits. Select a DataSet, then expand the tree to get to the limit you would like to update. Clicking the limit will enable editing. After editing is done, click Create/Update Control Limits to update the database.
Delete Control Limits
Select a limit that you would like to delete and click Delete Control Limits.
Acceptance Control Limits (ACL)
Acceptance Control Limits are for highly capable processes as defined by the Ford SPC Manual #SPC-411-A requirements. Acceptance Control Limits are:
Supported similarly to Trial Limits. If Acceptance Control Limits are enabled and the conditions are met, they will be used.
Calculated at run-time when and where needed.
Enabled when Control Limits are created or re-created by the user for a process baseline or via the Chart interface.
Based on the Process Cp, so Process Control statistics must be available.
Required to have a CpK greater than or equal to 2.50.
Only to use 'Beyond Control Limits' as the Out of Control condition.
Acceptance Control Limits only work when Ford Stat Rules are enabled. The variable ~limittype~ may be used to show when Acceptance Control Limits are being used instead of the standard control limits.
Enable Acceptance Control Limits
Acceptance Control Limits may be enabled in CM4D three ways:
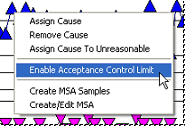
- Right click a point on a control chart and select Enable Acceptance Control Limits (or Disable, respectively). This will trigger Acceptance Control Limits and mark the feature characteristic selected as enabled (or disabled). A feature characteristic must have previously created regular control limits in order to be able to enable Acceptance Control Limits.
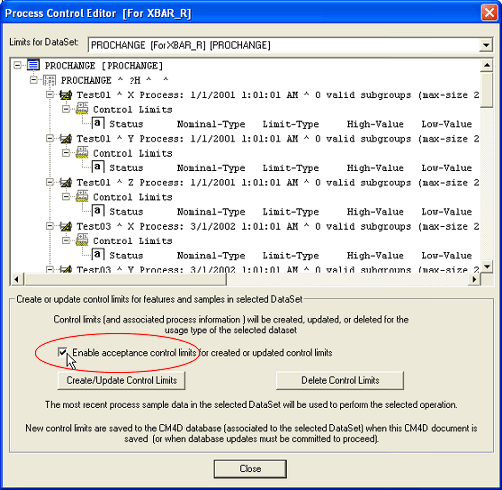
- To enable (or disable) Acceptance Control Limits for multiple features control limits, open the Process Control dialog, select a DataSet, enable (or disable, respectively) the Create Acceptance Control Limits check box. Acceptance Control Limits will be created.
- To enable (or disable) Acceptance Control Limits for a single feature control limit, open the Feature Editor. Select the Limits folder of a Feature and Edit an existing Control Limit. In the Create or Edit Limit dialog, select the Enable this Limit for Acceptance Control Limit Use.
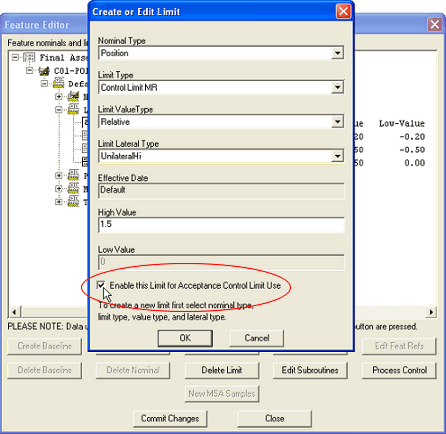
ACL Limit Type Label
Once Acceptance Control Limits have been enabled, those limits will display "-ACL" in the Limit-Type column as shown in the example below:
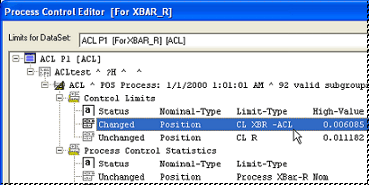
ACL Chart Labels
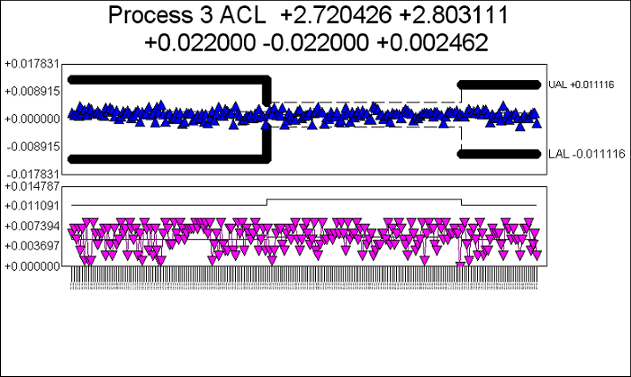
As shown in the chart below, ACL's are enabled/disabled per Feature Process, not per Feature. Upper and Lower Acceptance Control Limits are labeled as UAL and LAL, respectively.
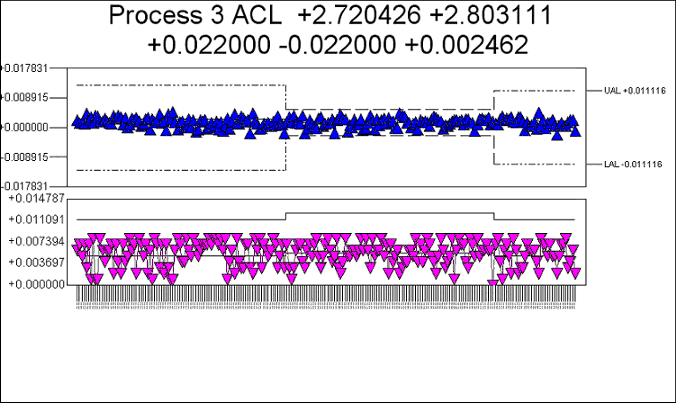
ACL Style Markers
Acceptance Control Limits can be marked using line styles within the Plot Space of the chart. To access these styles, open the Chart's annot properties, and edit the Chart Plot Space. On the General tab of the Plot Space properties, click the Line button. This will open the following dialog:
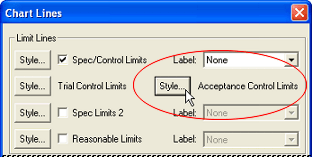
The Styles for the Acceptance Control Limits are set using the Acceptance Control Limits Style... button. Edit these styles according to your preferences, and then click ok. Exit all open dialogs to return to the sheet and view your changes.
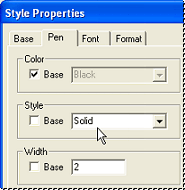
When Acceptance Control Limits are enabled, the ACL lines will be displayed by turning the Dash lines to thicker solid lines:
