Graph Types
Benchmark
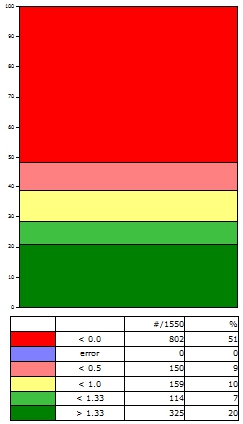
Benchmark Graphs display the results of comparing data within a specified grouping, such as a DataSet or DataStack. Benchmarks provide a method of comparing data within a specific grouping, such as in a DataSet or DataStack. How the data is compared will depend on what is selected as the Score type.
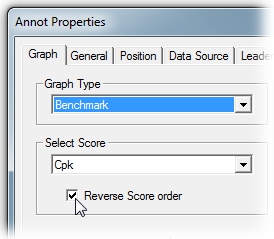
Select Score
In the Graph properties, you need to select a Score for the Benchmark. Scores are useful in areas where data needs to be converted to a score, grade, or tally. Scores can be used for CM4D DataStack evaluation operations such as the Score and Benchmark operations. Scores are also used to apply table and chart styles and to create benchmark graphs.
The Document Scores dialog has an option to Build Examples. This button will create two common examples of Scores (Cpk and TolEval), along with the Styles used by those Scores.
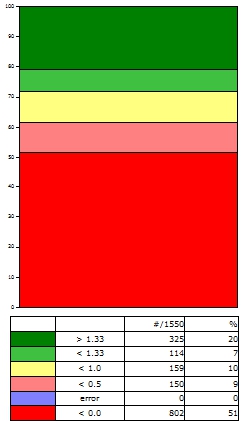
Reverse Score Order
When the Reverse Score Order check box is selected, the order of the score applied to the graph will be reversed so that information that was previously presented first will now be presented last in the graph. This option is available for Benchmark Graph types only.
 |
 |
 |
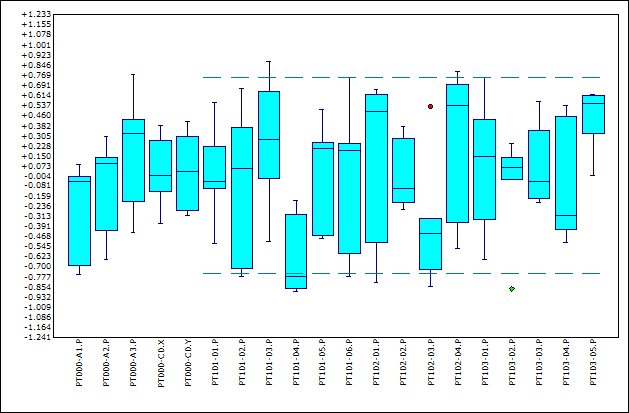
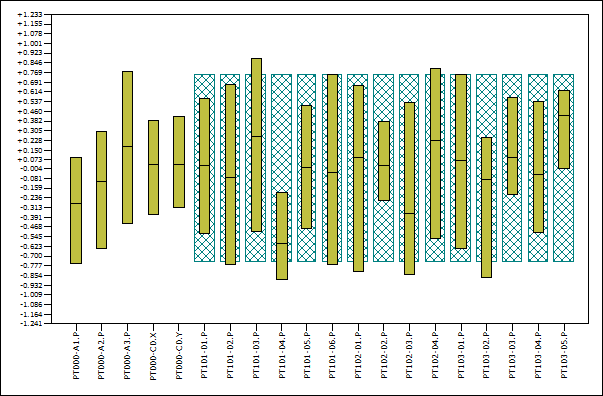
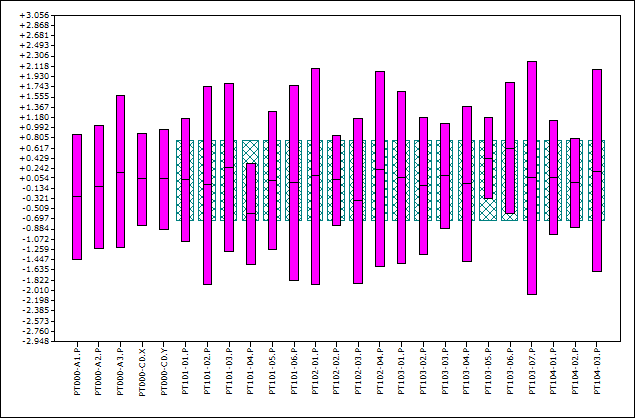
Box & Whisker
The various components of the Box & Whisker graph are labelled in the following example:
Short Horizontal Bars -
Dashed Lines -
Circles -
Center Line -
Upper and Lower Boundaries -
Diamonds -
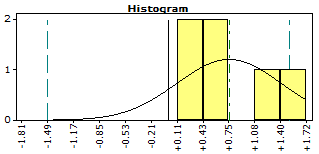
Histogram
MA-MR
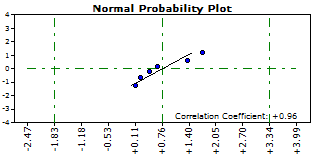
Normality
Pareto
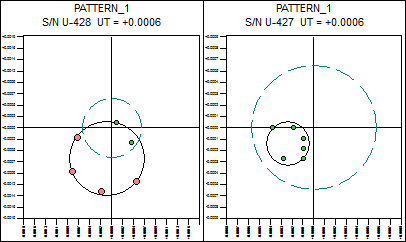
Polar
A special kind of Target chart. See the topic Polar Charts for more information.
Range
Six Sigma
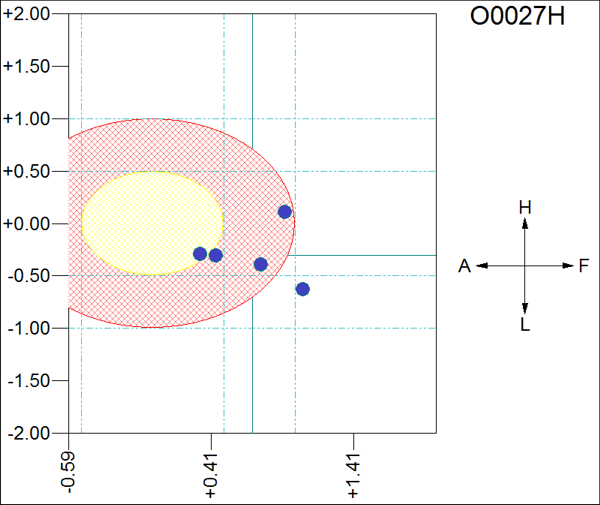
Target
What is called a Target graph in CM4D is sometimes referred to as a Scatter Diagram or Scatter Plot in general SPC terminology. Target charts plot variables on both axes, rather than only one axis (like with a Trend chart). Limit lines are displayed as circles around the points. Styles of limit lines and markers can be edited like any other chart.
Target graphs are not supported in CM4D Interactive or CM4D Workcell, as those modes of CM4D do not allow for the user to select the necessary second characteristic.
DataSets are not supported as the Datasource of a Target graphs.
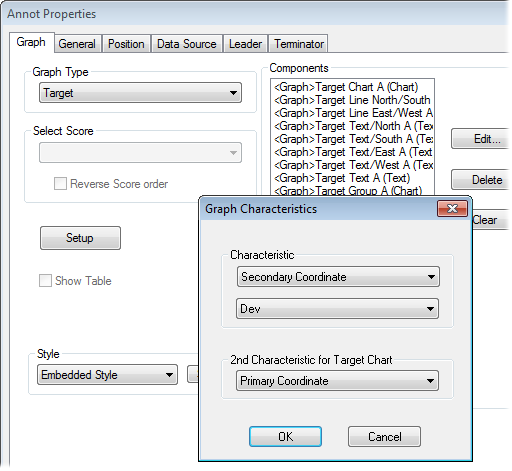
Setup
When setting up the Graph properties for a Target, you have to specify two variables for the Graph Characteristics in the Setup dialog. Select the first characteristic for the vertical axis and the 2nd for the horizontal axis.
Target graphs are not supported in CM4D Interactive or CM4D Workcell, as those modes of CM4D do not allow for the user to select the necessary second characteristic.
DataSets are not supported as the Datasource of a Target graphs.
Special Use - Polar Charts
Polar Charts in CM4D are a special kind of Target Chart used specifically for reporting Polar data. See the topic Polar Charts for more information.
Trend
A control chart used for process in which individual measurements of the process are plotted for analysis. Also called an individuals chart or I-chart.
XBar & R
A control chart used for processes in which the averages of subgroups of process data are plotted for analysis. A control chart based on the range (R) of a subgroup, typically used in conjunction with an x-bar chart.
XBar & S
A control chart used for processes in which the averages of subgroups of process data are plotted for analysis. A control chart based on the standard deviation, s, of a subgroup. The s-chart is typically used in conjunction with an x-bar chart.
X & MR
Can we improve this topic?