Create One Feature Per Sheet
The following tutorial will demonstrate how you can easily create a multiple-Sheet report that displays annotation for one feature (of a DataSet) on each Sheet.
Click the ( ) button in the upper left corner to view the video navigation.
*Adobe Flash Player is required to view this video. To download, visit Adobe.com.
If you cannot see the video above, you can view an alternate version here.
Summary of Steps
DataSet - with All Features (filtered with Sift Rules)
SheetSet
Annotation on Sheet 1 - DataSource set to DataSet created in first step, use Row 1 thru Row 1. Enable Sheet Sync.
Go to SheetSet Properties - Propagation.
Set to the number of Features in the DataSet.
Set Prefix if needed.
Click OK.
Create DataSet
Create a DataSet containing all of the features that you want to use in your report.
For this example, All Features in the Routine will be used as the DataSet DataSource.
Sift Rules are set to include only Polar Features with a Polar Characteristic to be loaded in the DataSet.
Create SheetSet
Create a SheetSet.
On Sheet 1, create a single annotation (chart, graph, or text box) for the first feature in that DataSet that you want to use.
Create a SheetSet.
On Sheet 1, create a single annotation (chart, graph, or text box) for the first feature in that DataSet that you want to use.
Create a title annot on the Title Sheet if desired for Headers, Footers, page numbers, version numbers, etc.
Create a View to point the leader line of the annot to.
The "Charts and View Singles" SheetSet will contain a total of 24 sheets, each displaying information on a Polar Constructed Feature. In this step, you will learn how this SheetSet was configured.
In the Sheets tab, create a new SheetSet labeled "Chart and View Singles".
Set the Sheet Size to ANSI C.
Do not change the name of "Sheet 1".
For the "Chart and View Singles" SheetSet, the first sheet will serve as a template sheet for all of the other sheets in the SheetSet. As this tutorial progresses, you will learn how to create multiple sheets from a single sheet, without using AutoReport. The resulting sheets will have the same annotation types and layout, but will display data for one Polar Constructed Feature per sheet. Once the first sheet is completed, the result should look like the image below:
Create a title annot on the Title Sheet if desired for Headers, Footers, page numbers, version numbers, etc. To learn about creating Title Blocks for your SheetSet, see the topic Title Blocks.
Create View(s)
Create a View to point the leader line of the annot to.
Turn on the sheet grid.
Create a new View annotation.
Right-click the view and select Properties
View Tab
Camera Type - Orthographic
Feature Markers
Marker for SMI Feature Type - Polar
Material - Artdeco>Yellow (1124)
Marker for SMI Feature Type - Hole
Shape - Sphere
Width - 16
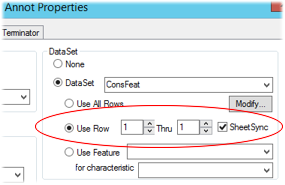
DataSource Tab
DataSet - ConsFeat
Use Row 1 thru 1
Check "SheetSync" Show/Hide Show/Hide
Click OK to save your changes and close the Properties dialog.
Right-click the view and select Orient>XZ (right).
Right-click the view and select Zoom>Zoom Max.
You could also put the View into Edit Mode and use the Zoom Box 3D button on the toolbar to zoom the view.
Copy the View and paste two copies onto the sheet.
Turn on the grid and line them up across the top portion of the sheet.
Resize the center view to fit between the two outer views.
Right-click the view on the right hand side of the sheet and select Orient>ZX (left).
Right-click the view in the center of the sheet and select Orient>ZY (front).
Save your document.
Create Table
Create a new table annotation.
Right-click the table and select Properties.
Table Tab
Setup:
Table Size
Rows - 10
Cols - 1
Uncheck "Display Row Headers"
Uncheck "Display Col Headers"
Table area:
Enter the following variables:
A1 - ~label~
A2 - ~miniball,ref#~
A3 - ~miniball,pnt#~
A4 - ~miniball,msk#~
A5 - ~miniball,z-dia~
A6 - ~miniball,z-told~
A7 - ~miniball,m-dia~
A8 - ~miniball,m-told~
A9 - ~miniball,x~
A10 - ~miniball,y~
DataSource Tab
DataSet - ConsFeat
Use Row 1 Thru 1
Check "SheetSync"Show/Hide Show/Hide
Click OK to save your changes and close the Properties dialog.
Create a copy of the first table annotation.
Right-click the table and select Properties.
Table Tab
Table area:
Enter the following text:
A1 - <blank>
A2 - Ref Count
A3 - Hole Count
A4 - Mask Count
A5 - PLTZ
A6 - PLTZ Tol
A7 - FRTZ
A8 - FRTZ Tol
A9 - Offset X
A10 - Offset Y
DataSource Tab
DataSet - None
Check "SheetSync"
Click OK to save your changes and close the Properties dialog.
Line them up next to each other in the bottom left quadrant of the sheet.
Turn off sheet grid.
Save your document.
Create Polar Chart (Graph Annot)
Turn on the sheet grid (if not already on).
Create a new graph annotation in the bottom right quadrant of the sheet.
Right-click the graph and select Properties.
Graph Tab
Graph Type - Polar
Components
Edit "Polar Chart A"
Components
Edit "Polar PlotSpace A"
Plot General Tab
Scale
Uncheck Auto
Min: -0.02
Max: 0.02
Inc: 0.005
Plot Top Area Tab
Scale
Uncheck Auto
Min: -0.02
Max: 0.02
Inc: 0.005
Edit "Polar Text A"
Text Tab
Delete text (~label~)
Click OK.
Style
Border
Rounded Box - 5
Setup
Select all check boxes
The following are specific Styles (different from Base Styles) for each Setup option:
Display Miniball
Pen Color - Teal
Display Miniball Limit
Pen Color - Gray
Pen Style - Dash
Indicate Miniball Beyond Limit
Pen Color - Lt Blue
Brush Color - Lt Teal
Display Zeroball Limit
Pen Color - Teal
Pen Style - Dash
Display Zeroball
Pen Color - Gray
Indicate Zeroball Beyond Limit
Pen Color - Olive
Brush Color - Lt Gray
Display Data Markers
Brush Color - Green
Indicate Data Beyond Miniball Limit
Brush Color - Yellow
Indicate Data Beyond Zeroball Limit
Pen Color - Black
Brush Color - Red
DataSource Tab
DataSet - ConsFeat
Use Row 1 Thru 1
Check "SheetSync"
Click OK to save your changes and close the Properties dialog.
Double-click the graph to enter Edit Mode.
Adjust the plot space to take advantage of the space available within the outer border of the graph.
Turn off the sheet grid.
Compare your results with the image shown at the beginning of Step 5.
Save your document.
Run Sheet Propagation
Once you have the first sheet set up, you will need to use the Sheet Propagation method to create sheets for each of the Polar Constructed Features in the DataSet.
Double-click "Charts and View Singles" in the Sheets tree.
In the Sheet Set properties dialog, click Sheet Propagation.
Number of Total Sheets - 24
Sheet Label Prefix - "Sheet " (note the space after "Sheet")
Click OK.
Click OK.
You should now have a total of 24 sheets in the "Chart and View Singles" SheetSet, each displaying a single Polar Constructed Feature and its Reference features.
Switch to the "Array" Sheet to check your overall results.
Save your document.
Can we improve this topic?