Processes Grid
The Processes grid contains all of the loaded Processes. A process is defined as a Feature and a Characteristic.
For example, the Feature A with XYZ Characteristics is three Processes:
Process 1 - Feature A Chr X
Process 2 - Feature A Chr Y
Process 3 - Feature A Chr Z
Choose Process Columns
![]() You can select which columns you want to see in your grid.
You can select which columns you want to see in your grid.
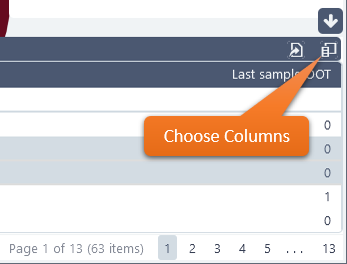
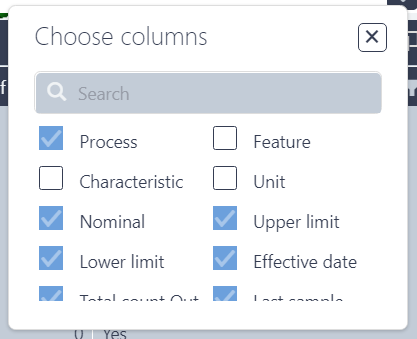
Open the Choose columns dialog.
Select the check boxes for the columns you want.
Uncheck the boxes for columns you do not want.
Use the
 |
The Processes grid has the following columns available:
|
Can we improve this topic?