This report displays summarized information for a checklist rather than for individual units.
When the report is opened, the user can filter the checklist results by custom dates, product, category or question type.
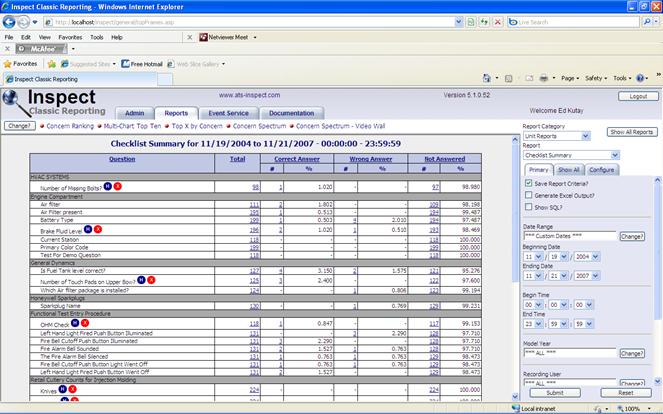
The report shows how many times each question was answered correctly, incorrectly or not at all.
Running this report will display a data table, similar to that shown in the following example:
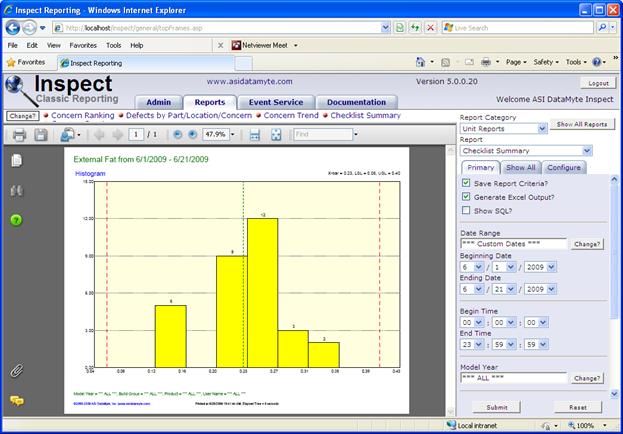
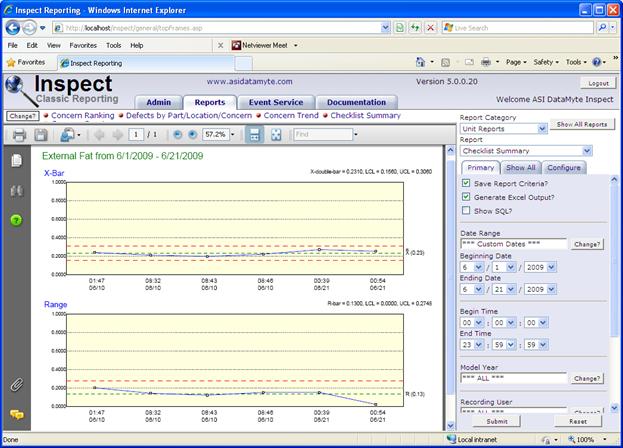
Next to each checklist question of number value result type, two icons lead to a histogram and an X-bar/R charts.