This is directional and the position of the mean and size of the standard deviation do not affect this rule.
The side of the mean for the third point is unspecified.
The side of the mean for the fifth point is unspecified.
Nelson rules are a method in process control of determining if some measured variable is out of control (unpredictable versus consistent). If any of these rules are broken during production then Inspect deems the system to be out of control.
In the examples shown below the Upper Control Limit (UCL) and Lower Control Limit (LCL) are 3 sigmas (standard deviations) from the mean. This is the standard method of control limit calculation. If the control limits are different then the other limits (1 sigma and 2 sigma) will be adjusted accordingly.
| Rule | Description | Chart Example | Problem Indicated |
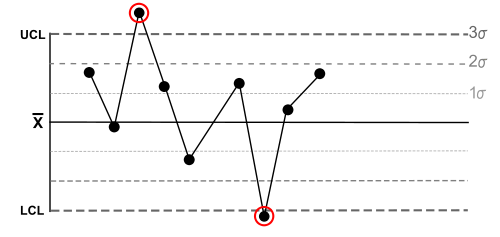
| 1 | One point is more than 3 standard deviations from the mean. | |
One sample is grossly out of control. |
| 2 | Nine (or more) points in a row are on the same side of the mean. | |
Some prolonged bias exists. |
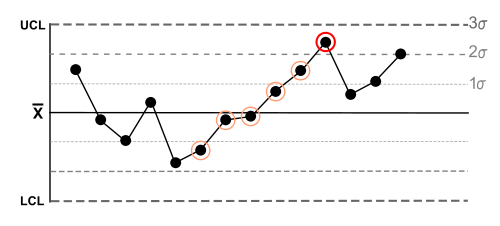
| 3 | Six (or more) points in a row are continually increasing (or decreasing). | |
A trend exists. |
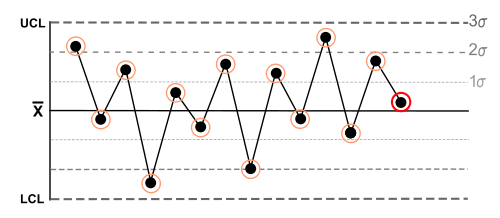
| 4 | Fourteen (or more) points in a row alternate in direction, increasing then decreasing. | |
This much oscillation is beyond noise.
This is directional and the position of the mean and size of the standard deviation do not affect this rule. |
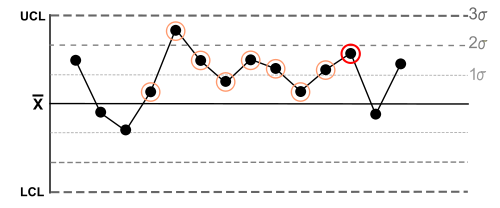
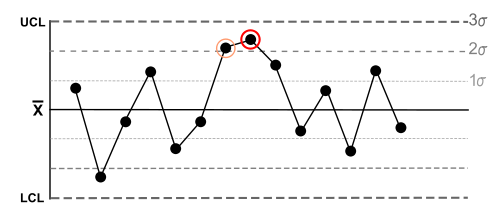
| 5 | Two (or three) out of three points in a row are more than 2 standard deviations from the mean in the same direction. | |
There is a medium tendency for samples to be mediumly out of control.
|
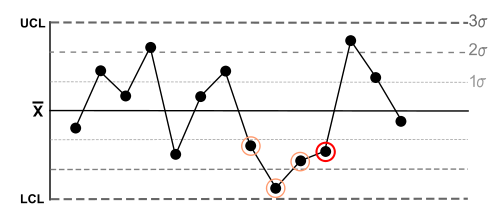
| 6 | Four (or five) out of five points in a row are more than 1 standard deviation from the mean in the same direction. | |
There is a strong tendency for samples to be slightly out of control.
|
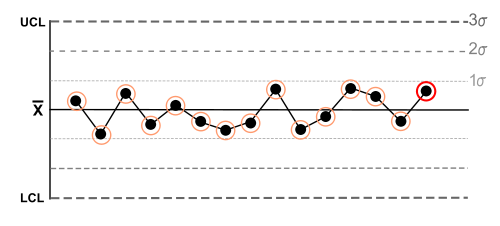
| 7 | Fifteen points in a row are all within 1 standard deviation of the mean on either side of the mean. | |
With 1 standard deviation, greater variation would be expected. |
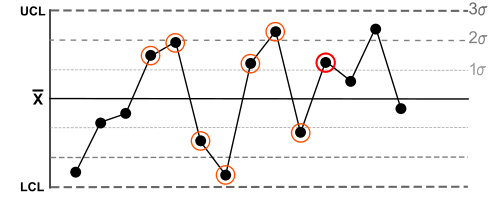
| 8 | Eight points in a row exist with none within 1 standard deviation of the mean and the points are in both directions from the mean. | |
Jumping from above to below whilst missing the first standard deviation band is rarely random. |