In this Topic Hide
Automatically Generate and Send Reports
Store Different Sets of Parameters for the Same Report
ATS Inspect Classic Reporting has been superceded in ATS Inspect 6.0 by ATS Advanced Reporting Services.
ATS Inspect generates reports using ATS ARS (Advanced Reporting Services). ATS ARS uses Microsoft SSRS, and so has all of its functionality, but it also gives you many other capabilities.
For a full description of the reports available to ATS Inspect refer to the separate report documentation (see here).
If you are running Internet Explorer 9 or higher you will need to run it in compatibility mode.
ATS ARS is accessed through your web browser.
Enter the following URL address:
http://ServerName/ATSAdvancedReporting
ServerName is the name or IP address of the reporting server in your facility.
You may need to modify the database connection on the reporting server first.
The application will open automatically.
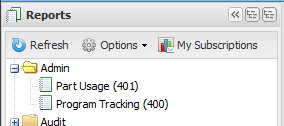
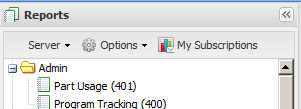
When you first enter ARS the reports will be listed down the left-hand side within categorized folders.
1. Expand the category you require.
You can use the icons in the top-right corner of the sidebar ( ) to expand and collapse
all the folders.
) to expand and collapse
all the folders.
2. Click Refresh, if required, to refresh the list of reports.
When you hover the mouse over the name of each report a brief description will be displayed.
3. Click on the report you require.
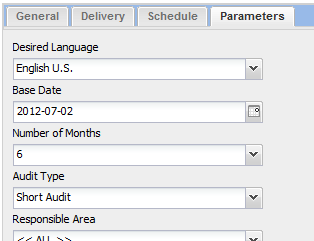
The possible parameters will be displayed down the right-hand side.
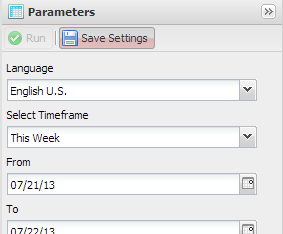
4. Select the parameters you require.
The parameters you select will be automatically saved for the next time you open the report. To disable parameter saving click Save Settings.
5. Click Run at the top of the parameters list.
The report is generated and displayed.
If you need more space to view the report you can hide the Reports and Parameters side panels by clicking the double-arrow icons at the top of each of them.
In many reports it's possible to view further information about an item. This is possible when the text is displayed as a hyperlink (blue and underlined by default).
Below you can see an example. It lists concerns in order of frequency.
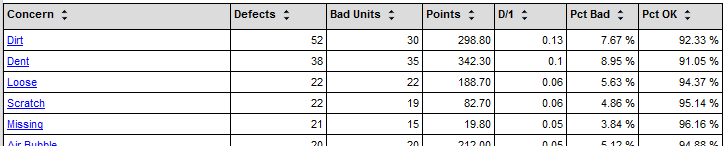
If you now clicked on Chem Process: Staining you would be given further details as shown below.
It lists all the components that had that defect. You could then go into further detail again by clicking on one of the components.
The items available for drilldown and the extra detail that they give vary from report to report.
It is possible to export a report to any of the following formats:
o XML file with report data
o CSV (comma delimited)
o PDF
o MHTML (web archive)
o Excel
o TIFF
o Word
1. Generate a report.
New icons are displayed above the report.
2. Click the export icon ( ).
).
3. Select the format you wish to export to.
4. Select the name and location for the file.
5. Click OK. The report will be exported in the selected format.
Subscriptions allow you to generate and send regular reports as files or to email addresses on a schedule. Each report must be subscribed to individually.
1. Select the report you wish to subscribe to.
2. Select Subscriptions at the bottom of the screen.
3. Click Add.
Four tabs are now displayed along the top of the screen.
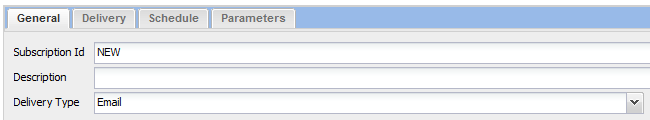
The Subscription Id is automatic.
4. Enter a description for the subscription.
Include the id of the report (the number in brackets after the report name) in the description so that it is easy to trace.
5. Select a Delivery Type. This is either File or Email.
6. Select the Delivery tab.
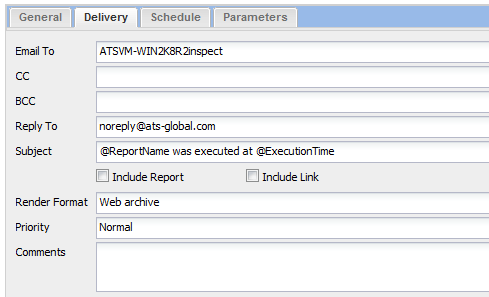
This section defines who the email will be sent to and how it will be sent.
7. Enter the email destinations in Email To, CC and BCC.
8. Enter the email address for replies in Reply To.
9. The Subject for the email can contain static text as well as two variables - @ReportName and @ExecutionTime.
10. Enable the Include Report and Include Link check-boxes as required to specify what will be sent in the email.
11. Select the format you wish to include the file in using Render Format.
12. Set the Priority for the email.
13. Include comments that will be sent with every email sent by this subscription.
Do not use the symbols "<", ">" and "&" in the comments section. These are special characters in XML and can cause an "AJAX communication" error.
14. Select the Schedule tab.
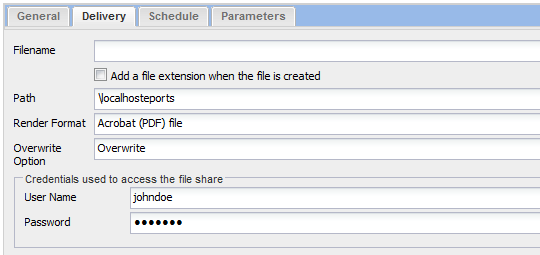
7. Enter a Filename for the generated report.
8. Enable the tick box to automatically add a file extension.
9. Select the Path where the report file will be stored.
10. Select the format you wish to include the file in using Render Format.
11. Select an Overwrite Option. You can overwrite the existing file with each new report, increment the filename of each new report, or not save the report if one is already present.
12. Enter credentials required for file share.
13. Select the Schedule tab.
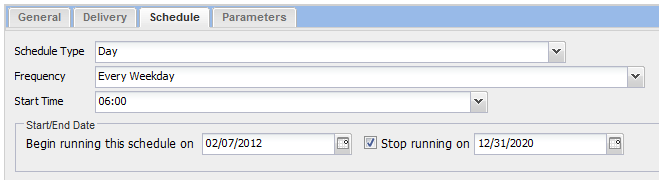
14. Select a Schedule Type.
The Frequency section will update depending on your selection.
15. Select the Frequency.
16. Select a Start and End Date.
17. Select the Parameters tab.
18. Enter the required parameters for the report. The possible parameters will be different for each report type.
19. Click Validate.
If the there is any information missing it will show a False result. You will then need to check the entered information in all the tabs to see if there is anything underlined in red which shows that information needs to be added.
If everything is okay then you will get a True result and you can save the subscription.
20. Click Save.
The subscription is now active.
You can test a subscription by selecting it and clicking Test. This will instantly send the subscription to the required recipients.
You can view all of your available subscriptions by clicking My Subscriptions above the Reports side-bar.
Configurations allow you to store a set of parameters for a report. For example, if you frequently wish to view a certain report specifically looking at a single production cell during each separate shift, you can save a different version of the report for each shift so that you can come straight back to them without modifying the configuration every time.
1. Select a report.
2. Select Configurations at the bottom of the screen.
3. Click Add at the top of the screen.
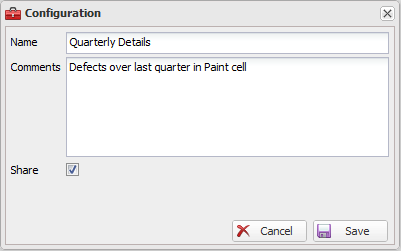
4. Enter a name for the configuration.
5. Enter Comments. This will be displayed when you hold your mouse over the configuration.
6. Enable Share if you want this configuration to be available to other users.
7. Click Save.
If you refresh the screen you will now see a + symbol next to the report in the list on the left side of the screen.
When you expand it it will list all available configurations. A shared configuration will have a hand icon beneath it.
If you wish to use a default configuration click on the name of the report.
If you have more than one server available you can switch between them by selecting the Server drop-down list above the Reports side-bar.
You can then select the required server from those listed.
The list of servers available is set in the web.config file.
The Options menu can be found above the Reports side-bar.
Enable this to automatically run a report as soon as you open it. The report will be run with the default parameters unless you have previously made changes to the parameters.
This setting states the default zoom level that new reports will open with. It also affects reports that are already open.