In this Topic Hide
Graphical reports only include data collected by images. Defect entry via text buttons will not be included.
This report displays an exact X/Y location of the defect as entered at a Data Collect terminal. Additional specific unit information can also be viewed.
The initial list displays the views for each product in order of the number of defects applied to them.
Select the Qty in the product row to view all the concern spectrums for that product. Alternatively, select the Qty for a specific view to see its individual concern spectrum.
Selecting one of the values in the concern spectrum will display the defects in that area in one of three ways. This can be modified using the Drilldown Type property:
● Scatter: View a scatter diagram of the types of concern in the selected area.
o Enlarge the scatter diagram using the Drilldown Magnification property.
o Enlarge the markers in the scatter diagram using the Marker Size property.
● Defects: View a list of the defects that were reported in the selected area. From within the list you can select an individual defect to see the Single Unit History report for the vehicle that had that defect.
● Trend: View a bar chart showing how defects were recorded over time in the selected area.
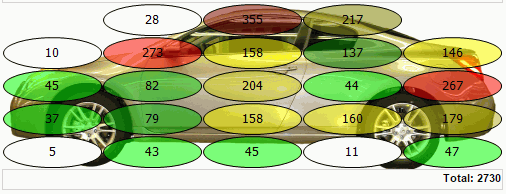
The image shows the concerns displayed in a circle, corresponding to the locations where the original defect was entered. The number in the circle represents the number of concerns in that region or circle.
The appropriate color is derived by finding the cell with the highest defect count within the view. It is referred to as the baseline value. Then each cell's relative percentage within that same view is calculated using the baseline value. Cell colors towards the red have the worst quality. Those in the green/white range (or without one) are the best.
Change the number of circles displayed by adjusting # Rows and # Columns. Use a low number to get an overall idea of where most defects are occurring in the view. For a more precise location, set the # Rows and # Columns to a larger number.


Select an ID from the list to view the Single Unit History (see here).
Parameter |
Description |
Desired Language |
The language the report results will be shown in. |
Date Range |
Either select a date range from the drop-down list or select a Begin Date and End Date using the two parameters below it. |
Begin Date |
The start date for the report. |
End Date |
The end date for the report. |
Shift |
The shifts to be included in the report. |
Model Year |
The model year to be included in the report. |
Product/Group |
The product(s) and product group(s) to be included in the report. |
Build Group |
The build group(s) to include in the report. |
Record Area/Group/Station |
The production area, group of stations or station where defects were recorded. |
Tracking Point |
The last tracking point the unit passed. |
Restrict to Units in Sample |
Only count defects that went through the specified tracking point. |
Responsible Area |
The area responsible for the defects occurring. |
Responsible Cell |
The cell responsible for the defects occurring. |
Part |
The part(s) to include in the report. |
Concern |
The concern(s) to include in the report. |
Rank(s) |
The rank(s) to include in the report. |
Group by Product |
Group the results by product. Products will be listed in alphabetical order. |
Drilldown Type |
How to display defect information when drilling into concern spectrum. Can be a Scatter chart, a list of Defects or a defect Trend. |
Drilldown Magnification |
Magnification for scatter chart, if used. |
# Rows |
The number of rows to divide the defects by. |
# Columns |
The number of columns to divide the defects by. |
Marker Size |
Size of defect markers in scatter chart. |
Image Width |
Width of image in pixels. |
Image Height |
Height of image in pixels. |
Solid Fill |
How transparent should the circles be? Lower number means more transparent. |
Limit To |
Only show the x highest ranked results. |