DataStacks - Statistics
The selected Statistics calculations are applied to the entire DataStack.
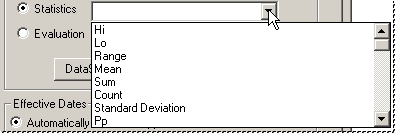
| Name | Description |
| Correlation Coefficient | Linear Correlation Coefficient measures the strength and the direction of a linear relationship between two variables. |
| Count | The number of valid values. |
| Cp | Capability index (potential capability). |
| Cpk | Capability index (potential capability corrected for centering). |
| Cpm | Capability of process index influenced by the difference between the sample mean and the nominal target value. |
| CR | Capability Ratio. |
| Hi | The highest value in the specified DataSet row. |
| Kurtosis | Measure of flatness of a distribution |
| Lo | The lowest value in the specified DataSet row. |
| Mean | The mean value of the valid data within a DataSet. The mean is the sum of values divided by the number (sample size) of values (i.e., the average value of a set of numbers). |
| Multiply As Percentages | A type of Six Sigma calculation performed on the selected DataStack(s). |
| Pp | Overall capability of the process, calculated using the method determined by the Non-Parametric Statistics flag. |
| Pp,Iso | Overall capability of the process, calculated using the Normal Distribution method. |
| Pp,Nd | Overall capability of the process, calculated using the Non-Parametric method. |
| Ppk | Overall capability of the process relative to dispersion and centeredness, calculated using the method determined by the Non-Parametric Statistics flag. |
| Ppk,Iso | Overall capability of the process relative to dispersion and centeredness, calculated using the Normal Distribution method. |
| Ppk,Nd | Overall capability of the process relative to dispersion and centeredness, calculated using the Non-Parametric method. |
| PR | Performance ratio. |
| Process Cp | Capability or potential of the process baseline. |
| Process Cpk | Capability of the process baseline index relative to dispersion and centeredness. |
| Process CpM | Capability of the process baseline index influenced by the difference between the sample mean and the nominal target value. |
| Process CR | Capability ratio using the process baseline. |
| Process Estimated Standard Deviation | |
| Process Grand Individual Subgroup Average (X-Bar-Bar) | |
| Process Grand Moving Subgroup Average (MA-Bar) | |
| Process Individual Average | |
| Process Lower Specification Limit | |
| Process Maximum Subgroup Size | |
| Process Moving Range Average (MR-Bar) | |
| Process Normal | |
| Process Pp | Overall capability of the process baseline, calculated using the method determined by the Non-Parametric Statistics flag. |
| Process Pp,Iso | Overall capability of the process baseline, calculated using the Normal Distribution method. |
| Process Pp,Nd | Overall capability of the process baseline, calculated using the Non-Parametric method. |
| Process Ppk | Overall capability of the process baseline relative to dispersion and centeredness, calculated using the method determined by the Non-Parametric Statistics flag. |
| Process Ppk,Iso | Overall capability of the process baseline relative to dispersion and centeredness, calculated using the Normal Distribution method. |
| Process Ppk,Nd | Overall capability of the process baseline relative to dispersion and centeredness, calculated using the Non-Parametric method. |
| Process PR | Process baseline performance ratio. |
| Process Range Average (R-Bar) | |
| Process Samples | |
| Process Standard Deviation | |
| Process Standard Deviation (S-Bar) | |
| Process Target Standard Deviation | |
| Process Upper Specification Limit | |
| Range | The range of data of the DataSet row. |
| Skewness | Measure of symmetry of distribution |
| Standard Deviation | |
| Subgroup Count | |
| Subgroup Hi | |
| Subgroup Invalid Count | |
| Subgroup Lo | |
| Subgroup Mean (Xbar) | |
| Subgroup Moving Average | |
| Subgroup Moving Range | |
| Subgroup Range | |
| Subgroup Standard Deviation | Standard deviation of a subgroup within a sample of data. Used to calculate Sbar. |
| Subgroup Sum | |
| Subgroup Valid Count | |
| Sum | The sum of all valid data within a DataSet row. |
| Variance | Returns the Variance value of a DataSet row. In a population of samples, the Variance value is the mean of the squares of the difference between the respective samples and their mean. Basically, it is the measure of the spread of data, or the standard deviation, squared. |
| Worst | The worst sample per feature. |
Can we improve this topic? Click Send Feedback in the upper right of the screen to share your comments!