A Capability Study is essentially a statistical analysis of the measured data of a feature compared to the tolerance limits of the feature. It attempts to determine how confident you can be that your manufacturing process is producing parts within the tolerance limits and will continue to do so in the future.
At its simplest the capability study calculates the process mean – the typical measured value of the parts produced, and the spread – how wide is the variation from one part to the next. If the mean is very close to a tolerance limit or the spread is large compared to the tolerance band then it is likely that your process will produce significant amounts of scrap.
ATS SPC’s capability study function also determines the distribution shape which best fits your measured data. This allows it to use the best possible statistical model to represent your process and hence make the most accurate possible predictions about its future behaviour.
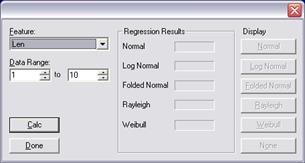
Choose a feature to study from the feature list box. By default ATS SPC suggests all the data in the feature but you may choose to examine a small subset if you wish. If you have selected a range of data in one of the chart controls ATS SPC offers that range as a default.
When you have set up the feature and data range, press the ‘Calc’ button to determine the best distribution shape for your data. Note that ATS SPC will not perform this calculation on less than 5 readings.
For an overview see: Capability Studies on page 91.
The Capability Study Results dialog shows the ideal curve of the selected distribution superimposed on the studied data so you can judge for yourself how good a fit it is. The numerical results, down the left, are calculated using the selected distribution. Many are familiar statistical values but some may need further explanation…
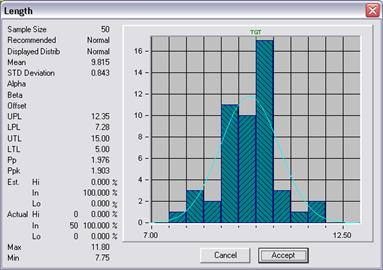
Sample Size: the number of readings (not subgroups) used in the study.
Recommended: the calculated best fit distribution.
Displayed: the distribution shape you chose to display.
Mean & Std Deviation: of the individual readings in the study.
Alpha: the scale factor for Weibull and Rayleigh distributions.
Beta: the shape factor for Weibull distributions.
Offset: allows use of distributions that normally start at zero to model data that starts at a non-zero value.
LPL, UPL: performance limits. For normal distributions these are the mean ±3s. For non-normal distributions they are the 0.135 and the 99.865 percentile points respectively.
LTL, UTL: tolerance limits.
Pp, Ppk: process performance indices calculated from the tolerance limits and performance limits. These values are roughly equivalent to the capability indices Cp and Cpk but are calculated using the sample standard deviation or its equivalent in non-normal distributions.
Est Hi, In, Lo: The estimated percentage of production falling above, within, and below the tolerance limits.
Actual Hi, In, Lo: the number of readings in the study falling above, within, and below the tolerance limits.
Max, Min: the maximum and minimum reading values in the study.