Histogram

Scatter chart

Process control chart
When you choose Print (or Print Preview) from the Batch menu ATS SPC opens the Print dialog where you can choose what to print. If you have more than one printer available you can also choose which printer to use.
The Print Dialog is divided into three regions.
In the top region you select the printer you want to use. The drop down list box shows all the printers installed on your system. The Properties button to the right opens the configuration dialog for the selected printer where you can select paper size, print quality etc. as defined by your printer’s drivers.
The middle region is needed only if you want to print multiple copies. Here you choose the number of copies and whether or not to collate them. Note that some printers do not support collation and multiple copies.
The bottom region is where you choose what to print – the feature, the range of data and the chart type, or types – you can choose to print any one chart type or a combination of several.
ATS SPC provides seven full page print layouts and one three to a page combination. Examples of each are shown below…
|
Histogram
|
|
Scatter chart
|
|
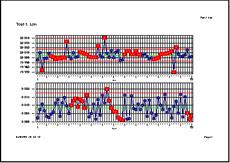
Process control chart
|
Measurements list – including time & date entered.
Statistics summary – including mean, standard deviation etc.
Logbook messages – including time and date entered.
|
Capability study
|
|
There is also a 3 in 1 combination printout giving a histogram, control chart, and statistics summary all on one sheet.
|
You can print all the data in a feature or just a selected range of subgroups or readings. In general scatter charts and process control charts tend to look better in landscape orientation while histograms and data print-outs are more suited to portrait format.
For more details see Print Dialog on page 96.
 If
ATS SPC cannot fit all the selected data on to one page it will spread
it over as many pages as required. See
Chart Points per Page on page 103 for details on how to change the
number of points on each page.
If
ATS SPC cannot fit all the selected data on to one page it will spread
it over as many pages as required. See
Chart Points per Page on page 103 for details on how to change the
number of points on each page.
1. Ensure the batch you want to print is the current batch, if it isn’t click on its view or press Ctrl+F6 until its view window gets the focus.
2. Choose Print from the Batch Menu.
3. In the Print dialog click on the feature list box or press TAB until the feature name is highlighted.
4. Open the drop down feature list box (press Alt+Down or click on the down button to the right) to select the feature to print.
5. Press TAB again or click on the All or Subgroups/Readings radio button and select the range of data to print.
6. If you selected Subgroups (or Readings) then set the start subgroup and the end subgroup. Type in or dial the subgroup numbers and press TAB again to move from start to end.
7. Press TAB again or click to select either portrait (upright) or landscape (sideways) orientation.
8. Press TAB again or click to scale the print-out to tolerances, data extents, or both.
9. Select the chart types you want to print. Either click on the chart icons or Tab to them and press Space to toggle them on or off.
10. Finally click the OK button or press Enter to start printing.