Monitoring Tools Overview
The following monitoring tools are available:
ServiceInsight: NServiceBus diagnostics tool showing messages and conversations. Uses ServiceControl to view all transmitted messages.
ServicePulse: NServiceBus health monitor for the bus stops (production monitoring). It processes heartbeat messages from the bus stops and it allows the user to resend failed messages.
Search for the application name on your computer to run them.
Installing NServiceBus Monitoring - This will install ServiceInsight and ServicePulse.
NServiceBus Architecture
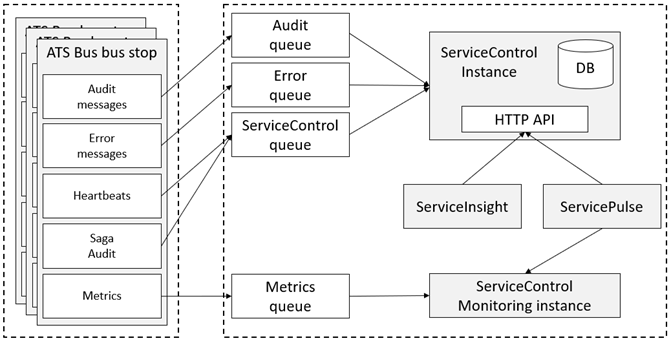
Before looking at the available tools it would be good to see how information flows from the bus stops to ServiceInsight and ServiceControl. The bus stops deliver their information to a queue where a ServiceControl and/or Monitoring instance consume them. There are four queues:
Message auditing
Messages that cannot be delivered due to an error
Heartbeat data (ServiceControl queue)
Metrics
The ServiceControl instance consumes from the audit, error and ServiceControl queue and stores the data in an internal database. The Monitoring instance consumes from the metrics queue and stores the data in an internal buffer for ten minutes. Both the ServiceControl and Monitoring instance expose their information via an HTTP API.
The types of queue being used depend on the type of NServiceBus transport that is configured in ATS Bus. Currently, ATS Bus supports RabbitMQ, Azure Storage Queues, Azure Service Bus, SQL Server.
The name of the error queue should be ‘Error’ and the audit queue should be named ‘Audit’, the ServiceControl queue and the Metrics queue should be named after the ServiceControl and Monitoring instance.
The ServiceControl and Monitoring instance can be installed on the same computer as where the bus stops are installed, but it is good practice to install the ServiceControl and Monitoring instance on a separate computer.
ServicePulse
ServicePulse is a health monitor for the bus stops (production monitoring). It processes heartbeat messages from the bus stops and it allows the user to resend failed messages.
The example shows that there are 19 heartbeat related issues, that 56 messages failed delivery and that there is one custom check that requires some attention.
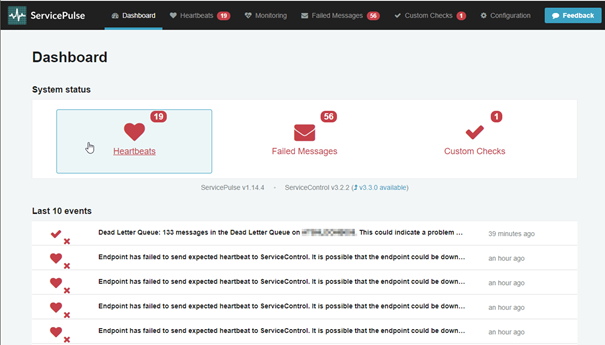
ServicePulse offers the following features:
Heartbeats: Shows whether a bus stop is alive or not.
Failed messages: Shows the messages that failed delivery and offers the possibility to retry or archive failed messages.
Custom checks: Shows the number of messages in the MSMQ dead letter message queue.
Monitoring: Shows queue length, throughput, processing time and other characteristics of the bus stop. This allows the user to diagnose possible issues with the ATS Bus configuration.
The monitoring section in ServicePulse uses the data obtained via the metrics feature in ATS Bus. Clicking monitoring shows the queue length, throughput, processing time and other metrics.
-
This requires a monitoring instance to be configured.

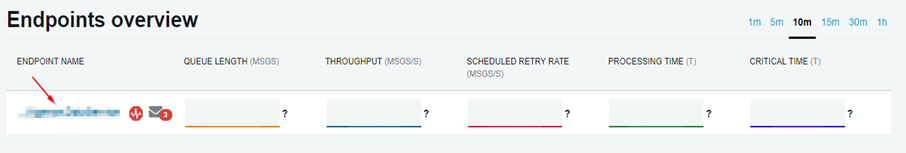
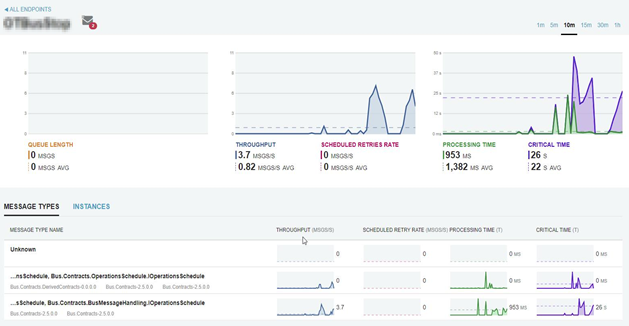
Selecting the bus stop (a.k.a NServiceBus endpoint) in the ‘Endpoints overview’ offers a more detailed view of the bus stop.
ServiceInsight
ServiceInsight can be used to view the messages flowing through the bus stops. It offers the following views:
Flow Diagram: This view shows all messages related to each other in a flow diagram. It shows the originating message, resulting messages and which bus stops are involved.
Saga: The saga view shows the content of the saga’s and which messages triggered changes in the sagas. This option is enabled by selecting ‘Enable Saga Auditing’ in the NServiceBus configuration tab of the OT bus stop.
Sequence diagram: This view does the same as the flow diagram, but it presents the information in a sequence diagram.
Headers: This view shows all NServiceBus message headers like source, destinations, timestamps, message ids etc.
Body: This shows the body of the message being passed between bus stops.
Logs: This view shows the communication between ServiceControl and ServiceInsight.
RESTful API
The bus stop monitor is also available as RESTful API. For further information, please click here.