Cause Labels can be assigned to points in a chart (as described in the example below), or to Process Baselines created using the Feature Editor.
1. In a chart which contains a point you want to assign a cause label to, move the mouse pointer over the marker of the point. The pointer will switch from an arrow to a cross-hair.
2. With the cross-hair cursor over the marker, right click and select Assign Cause.
3. The Assign Cause dialog will appear.
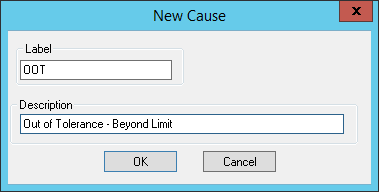
4. Create a new cause by clicking New Cause and entering a Label and Description of the cause.
Cause labels should be short, a few letters or a word. There is room to elaborate in the Description field. The Description is not displayed in the annotation.
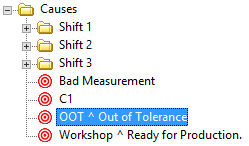
5. Select the new cause label from the Cause List.
6. After selecting the desired cause, you can choose to assign the same cause label to a number of consecutive points at one time. To do this, enter the desired number in the Also assign to next __ series points field.
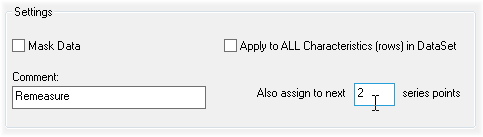
Remember, if you enter 9 in the series points field, for example, you will end up with a total of 10 cause labels.
7. Click OK.
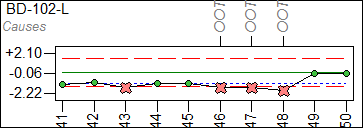
8. The cause label(s) will appear parallel to the marker, opposite the horizontal axis.
9. 
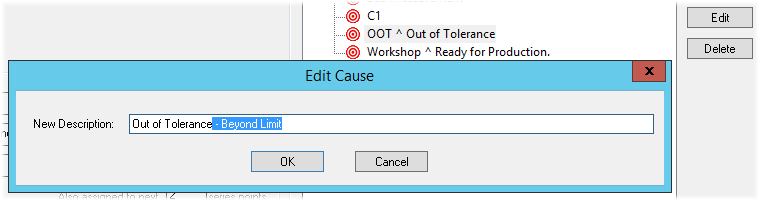
1. Select an existing cause from the Assign Cause dialog's Cause List and either click the Edit button or double click the label.
2. Enter a different description and click OK.
3. The new cause description will be assigned to the selected point and any points that may be in the series. The same cause label, however, will remain.