The Process Change Log records any changes made to the database that affect data measurement. The majority of these changes will be made using the Feature Editor. When a change is committed to the database, a comment must be entered in the Change Log Comment dialog. These comments are useful because they enable you to enter any information about why you are making the change, and that comment will be recorded in the Process Change Log. For example, when the tolerance value of a feature is changed and that change is committed to the database, a dialog will appear asking you to enter a comment:
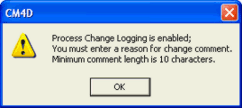
You cannot close the dialog without entering a comment. If you do, the following warning dialog will appear:

To view the details regarding your changes, click the Log Viewer ( ) button on the Log Editors toolbar. The Process Change Log Viewer allows you to view the details regarding your changes and to search for a change based on certain criteria (such as the Change Type, Filters, Time Period, etc.). When a search is initiated, all results matching the selected filters will be displayed in the Log Entries region. Log Entries can be sorted by any of the five categories by pressing the column header. Any user can modify their own comment by selecting their entry and then clicking the Modify button in the Selected Entry region of the viewer. None of the other details, such as DataSource or Site, can be altered. A user with any privilege can enter a non-data related comment into the Process Change Log by clicking the Create button in the User Defined section of the viewer.
If you have an Authentication Required License, you must also be assigned the Log Manager privilege to be able to Delete comments in the Viewer. However, if you do not have Authentication, there are no privileges, and any user can delete comments. These same requirements apply when using the Delete All Found button, which is useful when you want to delete numerous old Log Entries from the database at one time.
Logging can be disabled, but you must have the Disable Change Log privilege for the Enable ( ) and Disable (
 ) Change Logging buttons to function. Few users will have this privilege. If both icons are grayed, logging has been disabled at the Site database level. For more information on privileges, see the SiteManager documentation here.
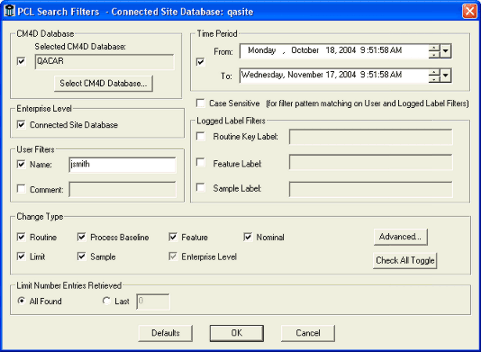
The PCL (Process Change Log) Search Filters dialog opens with default settings that can be modified according to your search requirements. All selected filters are combined to create one composite search string that returns results for all filter criteria. To narrow the search criteria down to one filter, uncheck all of the boxes except for the one you would like to search. If you would like to restore the default values after making changes to the filter settings, click the Defaults button on the bottom of the viewer.

|
DataSources |
The Search Filters defaults use the current DataSource of the current active Query. By clicking the Select CM4D Database button, you can open the Select Managed DataSource and choose one or more DataSources. |
|
|
Enterprise Level |
You can choose to use the Connected Site Database in place of or in addition to a CM4D database. |
|
|
User Filters |
This section allows you to filter your changes based on the Name of the author that made the change or on a specific Comment entered. You can use the variables asterisk (*) and percent (%) to search for multiple characters, or question mark (?) and underscore (_) when searching for single characters. These are both SQL and " C" compatible wildcards. |
|
|
Change Type |
This is a category listed in the Log Entries section of the Process Change Log Viewer. All types are selected as default, but these can be selected and deselected according to your search preferences. Every check box type selected will be searched for and displayed in the results. You can select or deselect all of these check boxes by clicking the Check All Toggle button. |
|
|
Advanced Change Types |
The Advanced button opens a dialog that contains groups of changes that narrow down the search to more specific change types. If only some of the check boxes in a group type are selected, the check boxes representing each main change type in the Search Filters dialog will be grayed.
|
|
|
Enterprise Level (logged in site database) |
Alarm Event searches for EventSmith email notifications. Managed Document Save searches for Managed Documents that have been saved. User Defined is used to search for non-data related comments. Any user can enter this type of comment by clicking the Create button in the User Defined section of the Process Change Log Viewer and entering any text you wish to log. |
|
|
Limit Number Entries Retrieved |
When the All Found radio button is selected in this region, an unlimited number of entries will be searched for in every DataSource you are connected to. If the Last radio button is selected, you can enter the number of entries per DataSource you want to display. The number chosen when Last is selected will be displayed on the bottom left corner of the Viewer. For example, if you want to search for the 10 most recent entries, and you are connected to three DataSources, 30 entries will be displayed in the viewer. |
|
|
Time Period |
The default Time Period has a search parameter of 30 days prior to the current date. This is set using the arrows, the calender, or by typing in the values of the dates you would like to search. |
|
|
Case Sensitive |
If the Case Sensitive check box is selected, the pattern matching in the User Filters and the Logged Label Filters region will be case sensitive
If the Case Sensitive box is unchecked, then the search is not case sensitive and all matches will be displayed in the results.
|
|
|
Logged Label Filters |
The three label filter options are Routine Key Label, Feature Label, and Sample Label. Either the routine code or the routine key can be entered for the Routine Key Label. To search with label filters, you can use the variables '*' and '%' to search for multiple characters, or '?' and '_' when searching for single characters. These are both SQL and C compatible wildcards. For example, if you are searching for a Routine Label that you know has C35 at the beginning, enter "C35*" and the search will return all entries that have Routine Labels beginning with C35. Pattern matching for Routine Key Label includes not only the Routine Label, but also the Key Filters. For example, if you use LH, RH, and CMM, you can do searches for patterns like " Frame*^cmm*LH" to find all Routines that start with Frame, are CMM Routines, and are also Left Hand. |
|
The Print to File function converts the current Process Change Log Search results into a text file. The text file can be saved, printed, and viewed in notepad. The Change Log Report will list the details of all the criteria that were used during the current search, as well as the details of each Log Entry as they would appear in the Log Viewer's Change Details section. Above each entry found will be a header specifying: CM4D Change Report (type of file), Date/Time the report was generated and who the report was generated for.
1. When the Print to File button is clicked, browse to the desired folder location and specify a file name.
2. Once the file is saved, a dialog will appear: "Are you sure you want to Print All ___ Log Entries to file?"
3. After clicking OK, a second dialog will appear: "Successfully printed ___ Change Log Entries to file C:\ foldername\MyChangeLogReportName.txt. Would you like to view this file in notepad text editor?"
a. If you click Yes, the file will open in notepad.
b. If you click No, the dialog closes without opening the Change Log Report file.
View a Change Log Report text file.
When you select a DataSource(s) and execute a search, the "Updates Pending" flag will be seen in the upper right section of the Log Viewer dialog if there are updates pending for one or more of the selected CM4D DataSources. There will never be Updates Pending for the Site Database, as those changes happen immediately.

Updates Pending signifies that there have been changes made in CM4D that have not been updated in the database at the time of the search for process changes (e.g. if a feature or a routine is modified, some of the changes are not committed to the database automatically). To view current changes, you need to close the Change Log Viewer, Update your database, re-open the Change Log Viewer, and run the search again with the same filters as the first search. You will notice that the red Data icon will have disappeared and your latest changes are displayed in the search result Log Entries.