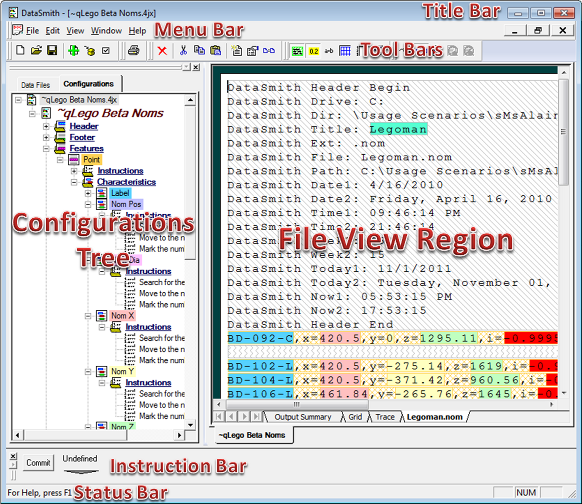
DataSmith’s User Interface contains a title bar, a menu bar, toolbars, an instruction bar, a file view region, and a status bar. The document region will contain windows for Feature Definition Files and data scans that you open.
The Title bar displays "DataSmith". It also contains the standard Windows title bar controls.At the left end of the title bar is the User Interface icon, which you use to access the Control menu. Double-clicking on the user interface icon closes DataSmith. At the right end of the title bar are the user interface Minimize and Maximize/Restore buttons and the Exit button.
Double-clicking on the text display section of any window title bar switches the window between its maximized and normal states.
The Menu Bar contains DataSmith's menus. Each menu lists several related selections, and each selection performs a specific action.
You open a menu by clicking on it, or by pressing <Alt> plus the letter that is underlined in the menu's title. For example, to open the File Menu, you would press <Alt> + <F>.
You choose a menu selection by clicking on it, by pressing its underlined letter, or by using the arrow keys to highlight it and then pressing <Enter>.
Menus and selections that are not currently available appear in gray.
Toolbar buttons perform actions similar to menu selections. The default docking region for the toolbar buttons is located below the Menu Bar. See the topic Toolbars for more information.
You can undock a toolbar by grabbing the double bar area of the toolbar and dragging and dropping it. Floating toolbars can be resized with the mouse. A floating toolbar can also be re-docked by dragging and dropping the toolbar over the toolbar docking region.
The Document Region is the area between the toolbar region and the status bar within the User Interface. This area is used to display DataSmith files and scan windows and their contents. More than one DataSmith file can be open at the same time. Scan windows are activated and brought to the front by using the Window menu and selecting the desired document window. DataSmith windows can be minimized, maximized, and moved within the confines of the document region.
The Grid tab in the File View Region shows the features you have defined and their characteristics in rows and columns.
Clicking the column header will select a column. Clicking a row number will select that row. All rows and columns in the Grid can be selected by clicking on the square in the upper left hand corner of the grid. Data which has been selected can be copied and placed on the clipboard.
The Grid identifies feature and characteristic data it has successfully processed by placing it in green fields. The empty blue fields indicate data which will not be processed by DataSmith. DataSmith indicates questionable data by placing it in yellow fields. Data which did not pass validation is in red fields.
The Trace tab in the File View Region displays all of the actions DataSmith has taken while executing your .4jr file. This is especially useful in determining the success or failure of your instructions.
The Instruction bar, when activated, is located under the User Interface. The instruction bar is used to write instructions. To activate the Instruction Bar, double click on an instruction.
Instructions are written by selecting words and phrases from menus. The Commit button activates an instruction after it has been written.
See the topic, Instruction Definitions.
The Status bar appears at the bottom of the User Interface. When you highlight a menu item or place the cursor over a toolbar button, the status bar displays information about the item or button. The status bar is also used for other DataSmith messages and can be turned on and off using the View menu.