Statistic
Symbol(s)
Description
Equation/Formula
CM4D Variable(s)
The value measured for a characteristic in a particular sample is called an “actual” value.
Actuals are not calculated by CM4D. They are inputs based on the inspection of an actual physical part.
~act,char~
Can compare values to one or two other values.
Can assign a cause for bad data. Causes are stored in the database, follow the data, and can be displayed in charts. Data can be masked from use in statistics, or hidden in database. See the topic Assign Causes for more information.
USL
LSL
Upper and lower spec limits
Spec Limits are inputs based on the design specifications
~USL~
~LSL~
Hibox
Value of member of DataSet that has the largest value that is less than or equal to UIF
~boxhi~
Lobox
Value of member of DataSet that has the smallest value that is more than or equal to LIF
~boxlo~
Linear Correlation Coefficient measures the strength and the direction of a linear relationship between two variables.
-
Also sometimes referred to as the Pearson product moment correlation coefficient in honor of its developer, Karl Pearson.

where n is the number of pairs of data.
~rp~
Cp
Capability index (potential capability)
~cp~
Cpk
Capability index (potential capability corrected for centering)
For bilateral tolerancing Cpk = the lower of CPU and CPL
For unilateral tolerancing Cpk = validof CPU and CPL
~cpk~
CpM
Capability of process index influenced by the difference between the sample mean and the nominal target value.
~cpm~
CR
Capability Ratio
~cr~
The term Deviation refers to the difference between a true measurement (or actual) for a given sample and the design (or nominal) value for a characteristic. Deviations have both magnitude and direction.
Deviation = (actual - nominal)
~dev,char~
A value that lies above the UOF or below the LOF.
Size of each subgroup within a DataSet, from 2 to 25
This is a value that is manually set in CM4D within the Query Properties dialog.
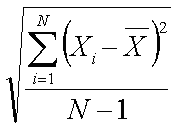
Alternate calculation for Standard Deviation under certain conditions. If subgroup size is invalid, or if the process is not in control, then the value is calculated as S.
or
S
Measure of variation among a sample of data
~stddev~
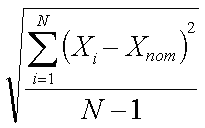
Standard deviation using a target (nominal) value in place of Mean. Used to calculate Cpm.
The highest value in the specified DataSet row.
~hi~
IQR
The difference between Upper Quartile and Lower Quartile.
Q3 - Q1
~iqr~
Count of invalid data, or number of cells that do not contain valid data, or do not contain any data.
~invalidcount~
Measure of flatness of a distribution
~kurtosis~
The lowest value in the specified DataSet row.
~lo~
LCLMA
Control limit for a particular characteristic for a particular use.
~lclma~
LCLMR
Control limit for a particular characteristic for a particular use.
~lclmr~
LCLR
Control limit for a particular characteristic for a particular use.
~lclr~
LCLS
Control limit for a particular characteristic for a particular use.
~lcls~
LCLXMR
Control limit for a particular characteristic for a particular use
~lclxmr~
Control limit for a particular characteristic for a particular use
~lclxbs~
Control limit for a particular characteristic for a particular use
~uclxbs~
LIF
Q1-1.5(IQR)
~lif~
LOF
Q1-3.0(IQR)
~lof~
Q1
Value of the data member where 75% of the data members are larger, and 25% are smaller
Data is sorted ascending
If N is odd, Q1 is the k value
If N is even, Q1 is the average of the k1 and k2 values
~q1~
The mean value of the valid data within a DataSet. The mean is the sum of values divided by the number (sample size) of values (a.k.a. the average value of a set of numbers).
~mean~
The mean (average) value of the mean values of valid subgroups within a DataSet.
~mean,ga~
The mean (average) value of the moving average values of valid subgroups within a DataSet.
~mean,ma~
The mean (average) value of the moving range values of valid subgroups within a DataSet.
~mean,mr~
The mean (average) value of the range of values of valid subgroups within a DataSet.
~mean,r~
The mean (average) value of the standard deviation values of valid subgroups within a DataSet.
~mean,s~
Q2
Value of the data member where 50% of the data members are larger, and 50% are smaller.
Data is sorted ascending
If N is odd, Q2 is the k2 value
If N is even, Q2 is the average of the k1 and k2 values
k1 = N/2
k2= (N + 1)/2
k3 = (N + 2)/2
~q2~
If data is missing within a subgroup, it will be replaced with the mean of the other values within the subgroup.
Count of cells in DataSet that do not have spec limits or tolerances.
~nospeccount~
The value assigned to a given characteristic by design is called the nominal. It represents the target for the given value.
Nominals are not calculated by CM4D. They are inputs based on the design.
~nom,char~
Count of cells in a DataSet that are out of spec or tolerance
~outofspeccount~
A value that lies above the BoxHi or below the BoxLo.
Percentage of cells in a DataSet that contain invalid data, or no data.
~percentinvalid~
Percentage of cells in a DataSet that contain valid data.
~percentvalid~
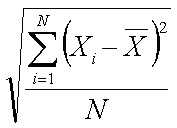
A.k.a. sigma, standard deviation of an entire population of data.
Pp
Performance index.
~pp~
Ppk
Performance index.
For bilateral tolerancing Ppk = the lower of PPU and PPL
For unilateral tolerancing Ppk = validof PPU and PPL
~ppk~
PR
Performance ratio.
~pr~
R
The range of data of the DataSet row.
~range~
Measure of symmetry of distribution
~skewness~
Standard deviation of a subgroup within a sample of data. Used to calculate Sbar.
n=subgroup size
The sum of all valid data within a DataSet row.
~sum~
Count of expected data, or the number of cells in a DataSet.
(Number of Columns) * (Number of Rows)
~totalcount~
UCLMA
Control limit for a particular characteristic for a particular use.
~uclma~
UCLMR
Control limit for a particular characteristic for a particular use.
~uclmr~
UCLR
Control limit for a particular characteristic for a particular use.
~uclr~
UCLS
Control limit for a particular characteristic for a particular use.
~ucls~
UCLXMR
Control limit for a particular characteristic for a particular use.
~uclxmr~
Control limit for a particular characteristic for a particular use.
~uclxbr~
Control limit for a particular characteristic for a particular use.
~uclxbs~
UIF
Q3+1.5(IQR)
~uif~
UOF
Q3+3.0(IQR)
~uof~
Q3
Value of the data member where 25% of the data members are larger, and 75% are smaller.
Data is sorted descending
If N is odd, Q3 is the k value
If N is even, Q3 is the average of the k1 and k2 values
~q3~
N
Count of valid data, or the number of DataSet cells that contain valid data. Not all cells in a DataSet have valid values. Data may be missing or masked via an assignable cause.
~validcount~
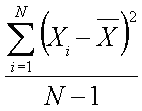
Returns the Variance value of a DataSet row. In a population of samples, the Variance value is the mean of the squares of the difference between the respective samples and their mean. Basically, it is the measure of the spread of data, or the standard deviation, squared.
~variance~


