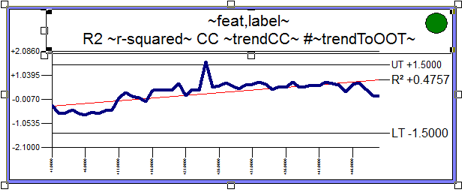
The Trend Line is a linear regression line in a Trend chart, finding the best-fitting straight line through the points. The trend line calculation includes the R-squared correlation, the trend correlation coefficient and the number of points from the last point given until the line goes out of tolerance. Whether the trend correlation coefficient is positive or negative indicates if the line is trending towards the upper or lower tolerance.
By default, the trend line is disabled. To enable the trend line and modify its style, see here.
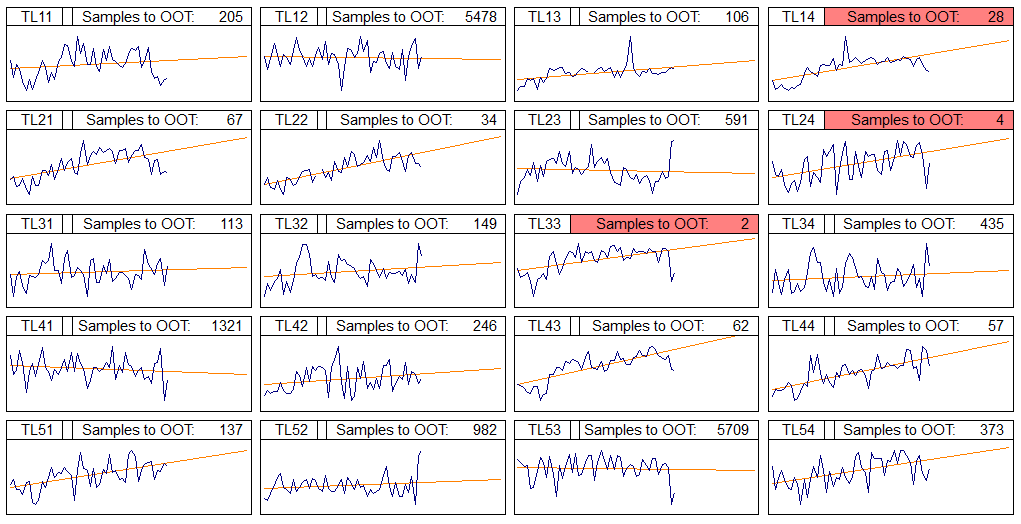
For a tutorial on how to create the report shown above, including Event notifications for the red conditions, see here.
The following variables may be used to return trend line information:
· ~r-squared~ - the squared correlation or basically a measure of how tight of a fit to the line the measurement points are. A value of 1 is a perfect fit.
· ~trendCC~ - the trend correlation coefficient. It is the square root of ~r-squared~ with a sign that indicates the direction of the line. Negative is down; positive is up.
· ~trendToOOT~ - the number of points, from the last point given, until the line intersects with the upper or lower tolerance. If ~trendCC~ is negative then the line is trending down so it will be crossing the lower tolerance and the opposite is true for trending up.
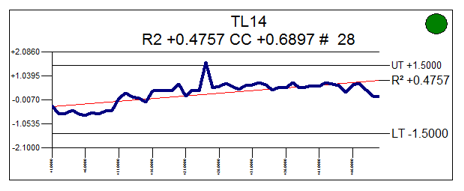
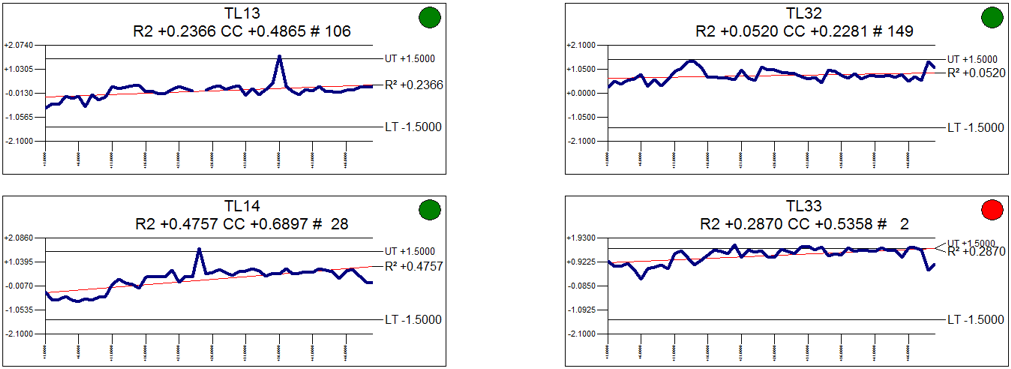
You can set up trigger indicators in your charts to easily identify how close your data is to trending towards out of tolerance. In the example below, Conditional Styles are configured to show either a green or red circle in the chart. The color of the circles is determined by the condition stating the number of points before the data goes out of tolerance.
To set up a similar indicator in your chart, go the to the Document Styles and complete the following:
1. Create a style called "Style Green":
a. Edit the style.
b. Set the Base Style to "!Spectrum Node Green".
c. Set the Brush Color to Green.
d. Click OK.
2. Create a style called "Style Red".
a. Edit the style.
b. Set the Base Style to "!Spectrum Node Red".
c. Set the Brush Color to Red.
d. Click OK.
3. Create a style called "Style Conditional".
a. Edit the style.
b. Set the Brush Color to Silver.
c. Go to the Conditionals tab.
i. Click Add.
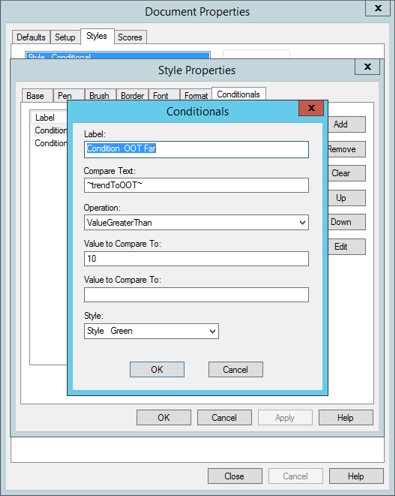
(1) Enter a label, such as "Condition OOT Far".
(2) Enter Compare Text "~trendToOOT~.
(3) Set Operation to "ValueGreaterThan".
(4) Enter Value to Compare To "10".
(5) Leave the second Value to Compare To field empty.
(6) Set the Style to "Style Green".
(7) Click OK.
ii. Click Add.
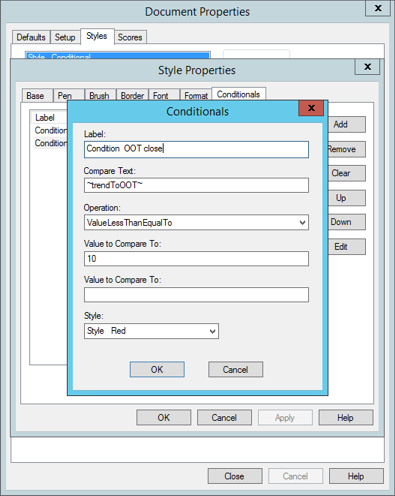
(1) Enter a label, such as "Condition OOT Close".
(2) Enter Compare Text "~trendToOOT~.
(3) Set Operation to "ValueLessThanEqualTo".
(4) Enter Value to Compare To "10".
(5) Leave the second Value to Compare To field empty.
(6) Set the Style to "Style Red".
(7) Click OK.
iii. Click OK.
d. Click Close.
4. Create a new shape in the chart plot space.
a. Edit the Shape properties.
b. Set the Style to Use Conditional Style.
c. Click Setup.
i. Select "Style Conditional".
ii. Click OK.
d. Click OK.
See also, Tutorial: Trend Lines and Out of Tolerance Events