 Reference
 The Miniball algorithm used in CM4D was developed by and is licensed from Bernd Gärtner of the Institute of Theoretical Computer Science in Zurich, Switzerland.

A Polar Chart is a specific target chart for the Polar characteristic of a Hole feature or the Polar characteristic of a Polar Constructed Feature.
· A Polar feature is a Constructed Feature with a Polar characteristic that represents the Miniball radius.
· Miniball is a calculation of the smallest enclosing circle that contains a set of points. Miniball Limits are set using the Spec Limit 2 of a feature.
· Zeroball is a calculation of the smallest enclosing circle that contains a set of points, centered on the Zero point. Zeroball Limits are set using the Spec Limit of a feature.
Reference
The
Miniball algorithm used in CM4D was developed by and is
licensed from Bernd Gärtner of the Institute
of Theoretical Computer Science in Zurich, Switzerland.
Data that may be used in Polar Charts must be one of the two feature types. Whether the feature is one or the other will determine how the data is evaluated within the Polar chart.
1. An SMI Hole or Slot Feature with a Polar characteristic - used in Multiple Sample Polar Charts
2. A Polar Feature with a Polar characteristic - used in Single Sample Polar Charts
The Single Sample Polar Chart evaluates multiple features in relation to one another within a single sample.
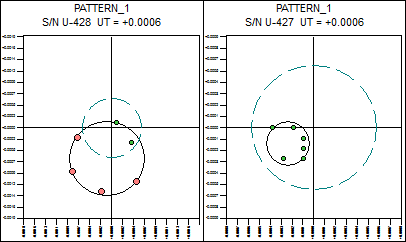
The Polar chart on the left is Beyond Limit; the Polar chart on the right is within Limit.
The Multiple Sample Polar chart evaluates multiples samples of a single feature.

Polar Charts are created using the Graph Annotation.
1. Create a new Graph Annot on the sheet.
2. Right-click on the graph and select Properties from the menu.
3. On the General tab:
a. Select Polar from the Graph Type drop down menu.
b. Click Setup...
c. Select the styles you want to use in the Polar Chart Styles dialog.
d. Click OK.
4. Select the DataSource tab and select the source of your data.
5. Click OK.
The markers of a Polar Chart may be customized via the Polar Chart Styles dialog.
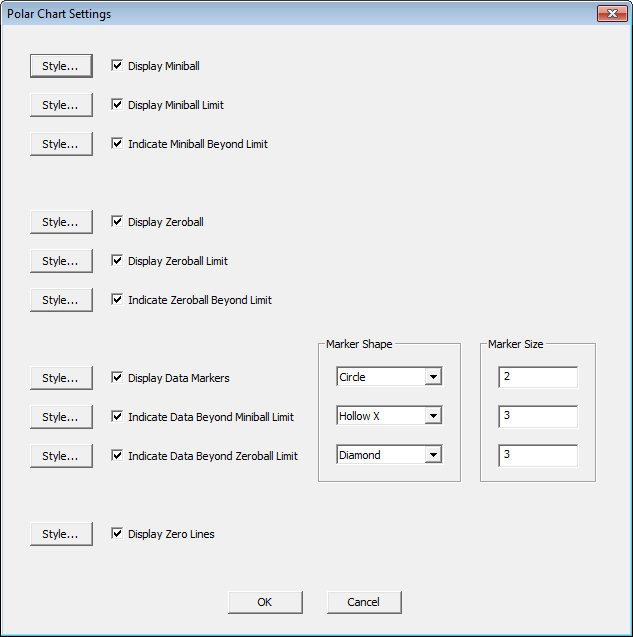
Select the Display Miniball check box to display the Miniball marker. In order for the Miniball to be clearly displayed, click Style... and assign a custom style. If the Miniball calculation meets a Beyond Limit condition, the Miniball marker will use the marker style set for the Indicate Data Beyond Miniball Limit condition.
Select the Display Miniball Limit check box to display the Miniball limit line (Spec Limit 2) within the polar chart. Click Style... to customize the style of the Miniball Limit line.
Select Indicate Miniball Beyond Limit to display the Miniball Beyond Limit line. Click Style... to customize the style of the Miniball Beyond Limit line. If the Miniball calculation meets a Beyond Limit condition, the Style set for Indicate Data Beyond Miniball Limit will override any styles set for Display Miniball.
Select the Display Zeroball check box to enable the Zeroball calculation in the Polar Chart and display the Zeroball marker. In order for the Zeroball to be clearly displayed, click Style... and assign a custom style.
Select Display Zeroball Limit check box to display the Zeroball Limit line (Spec Limit) within the Polar chart. Click Style... to customize the style of the Zeroball Limit line.
Select Indicate Zeroball Beyond Limit to display the Zeroball Beyond Limit line. Click Style... to customize the style of the Zeroball Beyond Limit line. If the Zeroball calculation meets a Beyond Limit condition, the Style set for Indicate Data Beyond Zeroball Limit will override any styles set for Display Zeroball.
Select Display Data Markers to show the data markers within the Polar chart. Set the Marker Shape and Size and then click Style... to set other styles properties for the data markers.
· Style... - Click Style... to set the appearance of the marker for each setting.
· Marker Shape - Select a shape for the Data Marker.
· Marker Size - Set a marker size from 0-1000 (decimals acceptable)
This option is not yet functional.
Select Indicate Data Beyond Zeroball Limit to show data markers within the Polar chart that are beyond the Zeroball limit.
· Style... - Click Style... to set the appearance of the marker.
· Marker Shape - Select a shape for the Data Beyond Zeroball Limit marker.
· Marker Size - Set a marker size from 0-1000 (decimals acceptable)
Select Display Zero Lines to display the lines (or "cross hairs") on the zero point of the chart.
When undesirable data is found within a group of points, you may want to flag these points so that CM4D will ignore, or "mask", those points before performing calculations.
 Tip
Tip
In
a Polar Chart, points can only be masked individually (Apply to All and
Series options are disabled).
Occasionally you may want to leave out, or flag, certain data by "masking" the data. Once data has been masked, it will not be included in the Miniball or Zeroball calculations.
To assign a Cause and mask a data point:
1. Move the mouse pointer over the marker of the point. The pointer will switch from an arrow to a cross-hair.
2. With the cross-hair cursor over the marker, right click and select Assign Cause.
3. The Assign Cause dialog will appear.
a. Select or create a cause.
b. To mask the data, select the check box next to Mask Data.
c. Click OK to assign the cause to the data.
4. The data point will appear as an X and will not be included in the Miniball calculation.
To remove a Cause and unmask a data point:
1. To remove an assigned cause, right click the marker with the cross-hair cursor.
2. Select Remove Cause from the menu.
3. The data marker will return to its normal state.
DataStacks may be used to perform analyses of the Miniball calculations. This type of analysis creates a specifically shaped DataSet that provides a visual representation on what the miniball data looks like. The same results may also be achieved using the Miniball variables, by building a table that only uses the variables you want to see.
The Analysis of Miniball Results DataStack evaluates the set of points used to calculate the Miniball.

Analysis of Miniball Results when viewed in the grid
Column |
Description |
Z-dia |
Diameter of the Zeroball, from center zero |
Z-tol |
Tolerance of the Zeroball |
M-dia |
Diameter of the Miniball |
M-tol |
Tolerance of the Miniball |
X-off |
Offset of the Miniball from the X axis |
Y-off |
Offset of the Miniball from the Y axis |
Ref# |
Number of features referenced by the constructed Polar feature |
Pnt# |
Number of points included in the Miniball calculation |
Msk# |
Displays the number of masked data points |
Z-out# |
Number of points that are Out of Zeroball Limit |
Z-out% |
Percentage of out of limit points for Zeroball {z-out#/pnt#} |
M-out# |
Number of points that are Out of Miniball Limit |
M-out% |
Percentage of out of limit points for Miniball {m-out#/pnt#} |
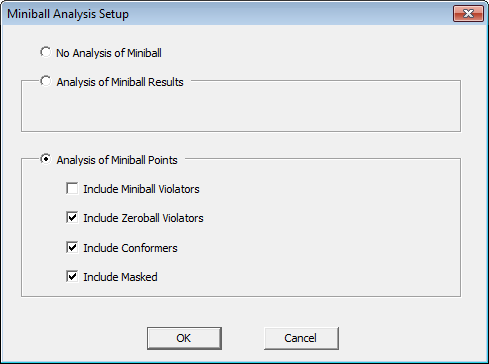
The Analysis of Miniball Points evaluates the individual points used to calculate the Miniball. The Reference Features used to create the Constructed Feature being analyzed will appear in the order in which they were added during the creation of the Constructed Feature.
· Include Miniball Violators - This option is not yet functional.
· Include Zeroball Violators - Includes all points that violate the Zeroball tolerance in the analysis.
· Include Conformers - Includes all points that conform to the Zeroball tolerance in the analysis.
· Include Masked - Includes masked points in the analysis.
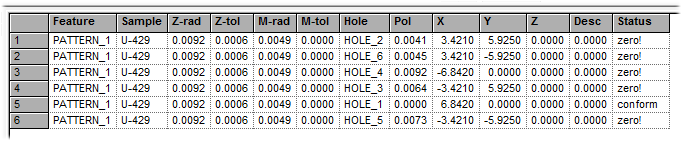
Analysis of Miniball Points when viewed in the grid
Column |
Description |
Z-dia |
Diameter of the Zeroball, from center zero |
Z-tol |
Tolerance of the Zeroball |
M-rad |
Radius of the Miniball |
M-tol |
Tolerance of the Miniball |
Hole |
Value of the Hole feature |
Pol |
Value of the Polar feature |
X |
Value of the X feature |
Y |
Value of the Y feature |
Z |
Value of the Z feature |
Desc |
Returns the Feature Description (if provided) |
Status |
Returns the state of the point within the Miniball calculation |
The following variables may be used to return various values related to the Miniball and Zeroball calculations.
Miniball Variables |
|
~miniball,isvalid~ |
Returns 1 or 0, indicating whether or not the Miniball is valid. The variable ~miniball,valid~ may also be used to return the same result. |
~miniball,msk#~ |
Returns the number of masked data points. |
~miniball,m-dia~ |
Returns the diameter of the Miniball. |
~miniball,m-out#~ |
Returns number of points that are Out of Miniball Limit. |
~miniball,m-out%~ |
Returns the percentage of out of limit points for Miniball {m-out#/pnt#}. |
~miniball,m-rad~ |
Returns the radius of the Miniball. |
~miniball,m-tol~ |
Returns the tolerance of the Miniball. |
~miniball,m-told~ |
Returns the diametrical tolerance of the Miniball. |
~miniball,pnt#~ |
Returns the number of points included in the Miniball calculation. |
~miniball,ref~ |
Returns the Reference Feature used in the Constructed Feature. |
~miniball,refdesc~ |
Returns the Description (if available) of the Reference Feature. |
~miniball,refpol~ |
Returns the Polar value of the Reference Feature used in the Constructed Feature. |
~miniball,refx~ |
Returns the Nominal X value of the Reference Feature. |
~miniball,refy~ |
Returns the Nominal Y value of the Reference Feature. |
~miniball,refz~ |
Returns the Nominal Z value of the Reference Feature. |
~miniball,ref#~ |
Returns the number of features referenced by the constructed Polar feature. |
~miniball,status~ |
Returns one of the five states of the Miniball calculation for a single feature. · Masked - The feature is masked · Conform - The feature is within the Miniball tolerance · Zero! - The feature is out of Miniball tolerance · Mini! - This status does not yet apply · Both! - This status does not yet apply |
~miniball,x~ |
Returns the horizontal offset of the Miniball. The variable ~miniball,x-off~ may also be used to return the same result. |
~miniball,y~ |
Returns the vertical offset of the Miniball. The variable ~miniball,y-off~ may also be used to return the same result. |
Zeroball Variables |
|
~miniball,z-dia~ |
Returns the diameter of the Zeroball. |
~miniball,z-out#~ |
Returns the number of points that are Out of Zeroball Limit. |
~miniball,z-out%~ |
Returns the percentage of out of limit points for Zeroball {z-out#/pnt#}. |
~miniball,z-rad~ |
Returns the radius of the Zeroball, from center zero. |
~miniball,z-tol~ |
Returns the tolerance of the Zeroball. |
~miniball,z-told~ |
Returns the diametrical tolerance of the Zeroball. |