Cause Comments can be used in addition to Cause Labels to customize the display of marked data when a cause has been assigned. Comments can be added to a single point or to a series of consecutive points. To assign a comment, select a cause label from the list of available labels or create a new cause label, then enter a Comment in the Settings region of the Assign Cause dialog. Select the Also assign to next __ series points check box to assign identical comments to a series of consecutive points.
In some cases, you may want to create a unique comment for individual points that share the same cause label and description:
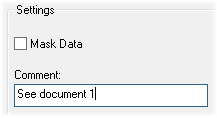
1. Open the Assign Cause dialog and select a cause label from the Cause List.
2. In the Settings region, enter a comment and click Apply.
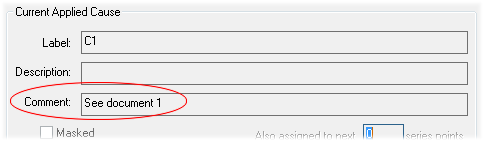
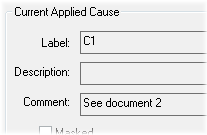
3. Your settings will appear in the Current Applied Cause section of the dialog. Click OK.
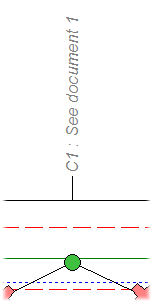
4. If the View Cause Comment check box is selected in the Chart Plot Space dialog, the cause comment will appear next to the cause label at the top of the control chart.
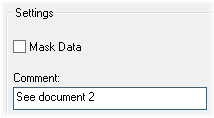
5. Choose another point, open the Assign Cause dialog, and select the same Cause Label from the list that was assigned to the previous point.
6. Enter a different comment for the second cause and click Apply.
7. Your new comment settings will appear in the Current Applied Cause section of the dialog. Click OK.
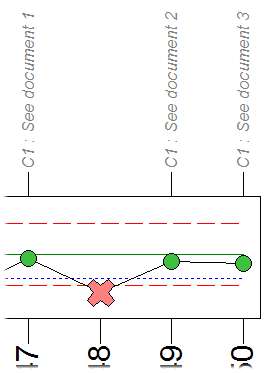
8. Continue assigning different comments along with the same cause label to each point as desired. As a result, the cause labels and comments appearing in your chart could resemble the following:
 Reference
See
also the variables ~act,cause,comment~
and ~cause,comment~.