To use the Graph ![]() tool to create a new Graph annotation, go to the Annotation menu and select Graph from the New menu, or click the Graph tool button on the toolbar. Your cursor will change to look like the Graph
tool to create a new Graph annotation, go to the Annotation menu and select Graph from the New menu, or click the Graph tool button on the toolbar. Your cursor will change to look like the Graph  tool.
tool.
Click and drag left mouse button across the sheet to create a graph the size you want.
You will then need to select the graph type you would like, and assign a DataSource to it. Both of these operations can be accomplished by right clicking on the graph and selecting Properties.
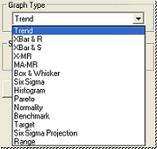
On the Graph tab of the Annot Properties dialog box, select the type of graph you would like from the Graph Type menu.

On the DataSource tab of the Annot Properties dialog box, assign a DataSource to the graph. More information about the types of DataSources each graph requires can be found in Graph Types.
To customize the appearance of your document, you can change the style properties.