 Nominal Search Parameters
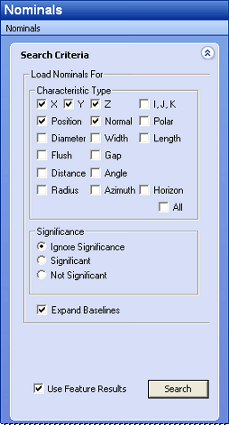 A search for all nominals can be performed, or the search can be narrowed down using the Load Nominals fields. Select parameters for both the Characteristic Type and the Significance of the nominals you want to search for, then click Search. Only one search can be performed at a time.
Refine your search using the Routine and Feature search options so that DataUtility will not need to load every routine from the Database. It is recommended that you leave the Use Feature Results check box selected (as by default) in order to reduce the amount of time required to fully execute the Nominal Search.
Characteristic Type
The seventeen available Characteristic Types refer to which types of nominals Data Utility will search for. For example, if the check boxes for X, Y, and Position are selected, DataUtility will only return results with those specific characteristic types. If a nominal does not have an X characteristic, then that nominal will not be displayed with the results. The Select All check box will select (or alternately de-select) all seventeen check boxes. By default, the Position and Normal check boxes are selected.
Significance
Select one of the radio buttons to designate the Significance parameter you want to set for the Nominal Search.
Expand Baselines
When the Expand Baselines check box is enabled, each baseline will be listed individually, with one row per baseline as shown in the image herehere.
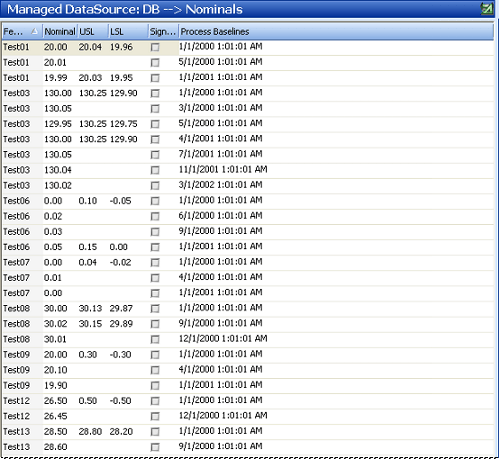
Use Feature Results
When the Use Feature Results check box is selected, the Nominal Search will only be done within the features that were returned for your current Feature Search. If no Routine or Feature Search was performed prior to your Nominal Search, DataUtility will conduct an internal default feature search and use all of the features found in your selected DataSource. The Use Feature Results option is selected by default.
Nominal Results
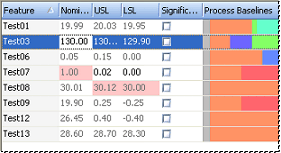
Once a search has been performed, your Nominal results can be sorted and edited in the result display region as shown in the images below. Nominal fields available for viewing will be listed in the Field Chooser region of the View Customization pane. Along with the fields shown in the image below, the following columns are also available: Feature, Significant, URL, USL2, LSL2, and LRL.
Any changes made to a will be highlighted in red until the change is either Reverted back to the original value, or the change is Committed to the Database.
An important thing to remember when editing nominal values and limits is that when modifying a grayed value, you are actually editing Bleed Through values, or those that were changed within a previous baseline. Use caution when making such a change, as it may have adverse effects on your data.
Modifying a Single Nominal Characteristic
To modify a single Nominal characteristic, for example, double click a Feature Label in the Display Region, enter a new name, then click off the label or hit the Enter key to set the change. Other editable properties of an individual Nominal can be modified this way as well.
Modifying Multiple Nominal Characteristics
Nominal characteristics can also be modified using the multiple select function. When more than one feature is selected, right click on a column of the highlighted features and choose one of the Edit options available in the context menu.
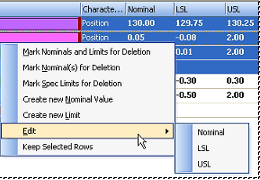
The menu is dynamic, based on the type of column was clicked. The menu will also contain a global Edit menu for every column currently available in the display region. In the example to the right, the menu was opened from the Process Baselines column, and although that specific column is not editable, the Edit context menu shows other options as being available for modification. The type of edit dialog that appears depends on the property type being modified. For example, if you are modifying a label, a dialog containing a text field will appear. Numbers will initiate a value dialog (only numerical values will be accepted). Any field that contains a menu when being edited individually will open a dialog containing radio buttons for each of the pre-defined options for that particular column.
Create a New Nominal Value
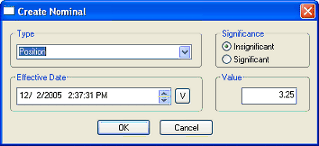
New Nominals can be created by right-clicking a feature and selecting Create new Nominal Value from the context menu and defining the Nominal Values within in the Create Nominal dialog. Selecting multiple features for this operation will create the same Nominal Value for each feature selected.
Create a New Limit
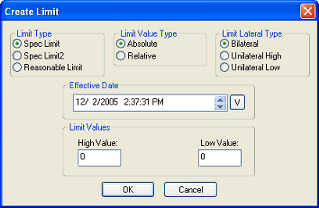
New limits can be created by right-clicking a feature and selecting Create new Limit from the context menu and defining the limit properties within in the Create Limit dialog. Selecting multiple features for this operation will create the same Limit for each feature selected.
Active Effective Date
The Active Effective Date menu will be populated when a Nominal Search is executed, based on the process baselines of the data shown in the display region. This menu will always includes two default options as well, <now> and <default>. <Now> represents the date and time that the search was executed (i.e. the current status of the resulting baselines), while <default> depicts the default baseline as defined by the feature.
The nominal and limit columns will reflect the date chosen in the Active Effective Date menu. Values that are in grayed font (e.g. -0.30) represent the "Bleed Through" values, or those that have been carried over from somewhere else (i.e. an older effective date). Those values that are not gray (e.g. 19.91) indicate that the value "Has Active Effective Date", or that it had been changed at the exact time of the process baseline date selected in the Active Effective Date menu.
The arrow button (![]() ) next to the menu will open a calendar from which you can select a custom date and time. If the date you choose does not land on an existing process baseline, the custom date will be added to the beginning of the Active Effective Date menu. All user defined dates will remain in the menu until a new search is executed, or until DataUtility is closed.
) next to the menu will open a calendar from which you can select a custom date and time. If the date you choose does not land on an existing process baseline, the custom date will be added to the beginning of the Active Effective Date menu. All user defined dates will remain in the menu until a new search is executed, or until DataUtility is closed.
When the Active Effective Date menu is highlighted, you can use the keyboard arrow keys to sift through the various process baselines in order to view their progression in the display regions Process Baseline column.

Reading the Process Baselines Image
The first band for every features process baseline will be the <default> process baseline, represented by the gray band. The vertical red band running through all displayed rows (indicating the Active Effective Date) will move left to right according to the date selected in the Active Effective Date menu. In the example below, the red band is in the <default> position. Each active process baseline (or those with the selected Active Effective Date) will be outlined with a black rectangle.
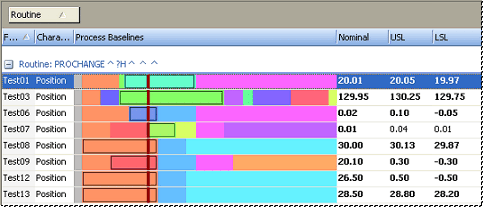
Nominals with matching effective dates will also be assigned the same color. For example, in the image above, all of the features started out with an orange band after the default (gray) baseline, indicating that every nominal value was changed and/or created on that effective date. Each time a change is made to the nominal or limit values, a new color band is assigned to each modified nominal. In the image above, the four features Test01, Test06, Test07, and Test09 all have pink bands, indicating that each was modified in some way on the same effective date.