Chart Properties - Chart Series
The Chart Series dialog controls the style of the markers and the series in the plot space of a chart.
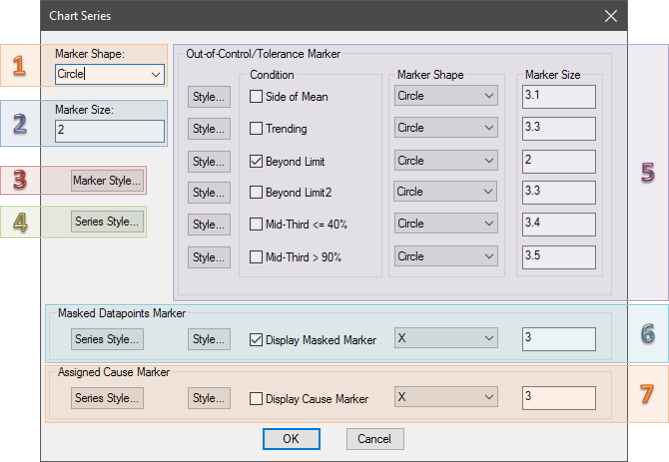 1. Marker Shape
You can select a marker shape other than the default circle. These options include asterisk, diamond, plus, square, north triangle, south triangle, east triangle, west triangle, x, check mark, hollow plus, hollow x, and four corner star.
2. Marker Size
Entering a larger number increases the size of the marker. Entering a smaller number decreases the size of the marker. Marker Size is limited to values between 0 and 1000.
3. Marker Style
Clicking Marker Style will open the Style Properties of the marker.
4. Series Style
Clicking Series Style will open the Style Properties of the Inter-Feature lines. If you find that the default styles have been changed, this may be because the Inter-Feature Lines' styles were changed in the Chart Lines dialog.
5. Out-of-Control/Tolerance Marker
By selecting the check boxes next to the Out-of-Control/Tolerance Markers you can turn them on or off. You can edit the Style Properties, Marker Shape and Marker Size of each Out-of-Control/Tolerance Marker individually.
Conditions:
- Side of Mean - indicates points that meet the requirements for statistical run on Side of Mean Rule.
- Trending - indicates points that meet the statistical requirement for Trending.
- Beyond Limit - point is outside of the specified limit of control, or the specified tolerance for acceptable values.
- Beyond Limit2 - point is outside of the second specified limit of control.
- Mid-Third <= 40% - points that meet the "Mid-Third 40% Rule" of Statistics.
- Mid-Third > 90% - points that meet the "Mid-Third 90% Rule" of Statistics.
6. Masked Datapoints Marker
Clearing the check box next to Display Masked Marker will turn off the masked data points markers, and they will appear using the standard chart series markers. Selecting the Display Masked Marker check box will turn on the masked markers. The option fields for Masked Marker Shape and Masked Marker Size are the same as the standard marker settings.
- Series Style - the Masked Marker's Series style can be modified by clicking the Series Style button in the Masked Datapoints Marker section of the Chart Series dialog.
- Style - The Style Properties of the marker can be edited by clicking Style.
- Display Masked Marker - if enabled, points that are masked will be displayed in the annotation.
7. Assigned Cause Marker
The indicator for points that have been assigned a Cause.
- Series Style - the Masked Marker's Series style can be modified by clicking the Series Style button in the Masked Datapoints Marker section of the Chart Series dialog.
- Style - the Style Properties of the marker can be edited by clicking the Style... button.
- Display Cause Marker - if enabled, points that have an assigned Cause are displayed in the annotation.
Can we improve this topic?