Chart Plot Space
The Plot Space of a chart or graph refers to the area within the annotation which contains and displays data.
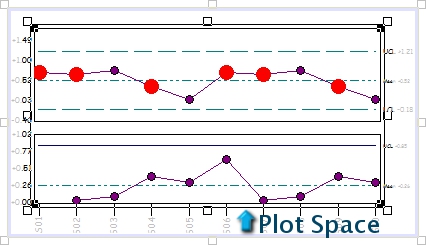
The plot space can be divided by percentage into two areas- top and bottom. The chart/graph will automatically determine the use of the top and bottom areas by examining the chart annotation's DataSource.
The DataSource for a chart must be a DataSet as the DataSet properties determines what data appears in the chart. See here for more information on chart DataSources.
There are five usage types for DataSources within a chart:
- Individual Value: When the DataSet usage associated to a chart is for individual values only, only the top plot space area will be used; the bottom area will not be used.
- X-MR: Plots individual value on top and moving range on bottom; both areas of the plot space will be used.
- MA-MR: Plots moving average on top and moving range on bottom; both areas of the plot space will be used.
- XBar & R: Plots subgroup mean on top and range on bottom; both areas of the plot space will be used.
- XBar & S: Plots subgroup mean on top and sigma on bottom; both areas of the plot space will be used.
Plot Properties
To modify the properties a chart Plot Space, go to the chart properties, select the Plot Space in the Components list of the Chart Annot Properties dialog and click Edit. Make the desired changes and then click OK twice to return to the sheet to view your changes.
Plot General Properties
The general properties apply to the overall chart. If the chart type specifies a Top or Bottom area, each of those can be set independently via the corresponding property tab.
Cause Settings
Cause Settings relate to settings related to Causes within a Chart. Some Cause information can also be viewed in the Status bar by hovering over the cause with the cursor.
- View Causes - Selecting View Causes will display any cause labels on the chart. This option may be used in conjunction with View Cause Comments.
- View Cause Hierarchy -
- View Cause with Parent Only -
- View Cause Comments - Selecting View Cause Comments will display any cause comments in the chart. This option may be used in conjunction with View Causes.
- Cause Style - Allows you to modify cause font and format properties.
Top Plot Area %
This number specifies the percentage of the total plot space area that will be allocated to the top area of the chart. You can enter the number or use the spin buttons to change the percentage.
The individual usage chart (e.g., Trend chart, Run chart) is the only one of the five types that uses only the top area. For this chart you must set the area % for the top to 100% and the area % for the bottom to 0%.
For the other four types set these values at the desired amount you want displayed for top and bottom (i.e. 60% top, 40% bottom).
Bottom Plot Area %
This number specifies the percentage of the total plot space area that will be allocated to the bottom area of the chart. You can enter the number or use the spin buttons to change the percentage.
The bottom area may be used by all chart types, except for Individual Value charts (e.g., Trend or Run).
Plot Area (Top/Bottom) Properties
To modify the properties of the Top or Bottom Plot Area of a chart, select the Plot Space in the Components list of the Chart Annot Properties dialog and click Edit. Make the desired changes and then click OK twice to return to the sheet to view your changes.
Area Style
Area style allows you to control the plot space area background and border properties.
See the topic Style Properties for more information.
Series
In the Chart Plot Space dialog, selecting the Lines button allows you to add or modify chart lines. There are many different types of lines that you can add to your chart.
See the topic Chart Series for more information.
Lines
In the Chart Plot Space dialog, selecting the Lines button allows you to add or modify chart lines. There are many different types of lines that you can add to your chart. Each line type has Style properties such as color, thickness, and pen style. You can edit chart lines, making them a different color or dashed, for example. Changing the style of lines can help to differentiate between multiple lines in a chart.
The Spec/Control Limits, Trial Control Limits, Spec Limits 2, Reasonable Limits, Nominal/Zero, Center Line and Mean lines can display their labels and values to the right of the chart plot space. To display the label of the line, select Label Only from the Label menu. To display the label and the value of the line, select Label & Value from the Label menu.
See the topic Chart Lines for more information.
Plot History Properties
The Plot History properties enables the History Bars in a graph annotation sets the styles.
History bars represent previous processes. History Bars appear as a vertical bar (like box and whisker) within either the left or right portion of a graph. The vertical bar represents the control limits (upper and lower edge of bar) and the mean (center line) of a given process.
Show - Left or Right
Enable Show to display the Plot History.
% of Plot Area
Set the percentage of the plot area that you want to use to display the plot history.
Area Style
Area style allows you to control the plot space area background and border properties. See the topic Style Properties for more information.
Marker Style
Set a style for the Markers in the Plot History.
Marker Line Style
Set a style for the lines connecting the markers (series markers) in the Plot History.
Plot Axis Properties
The various areas of the plot space have their individual axis properties, but the property definitions are common between them as described here:
- Location - Indicate the area where the axis label is displayed.
- Tick Size - The tick size is the size of the hash marks that comes off of the axis and marks the position for the corresponding labels.
- Scale - The axis scale defines the axis value range for the chart and will typically set to cover the range of values that will be plotted. Select the Auto check box to have scales computed automatically by the chart. The chart will auto scale to fit all of the samples or features in the charts data source.
- To provide your own scales, uncheck the Auto check box and provide the minimum and maximum scales desired.
- Unreasonable (too large or too small a range) values may produce undesired results.
- For the Historical Horizontal Axis, the scale defines the date range for the history you want to display in the chart. Select the number of oldest and/or newest historical axes to display.
- Axis Style - Axis style allows you to alter axis line and font properties. See here for more information on style properties.
- Labels - Indicate the desired type of axis labels. The labels will be the scale value for the label interval position on the axis. Text labels will be either the sample label or feature label.
- For single Routine charts, a variable such as ~sample~ or ~samp,date~ can be entered in the field below the Text radio button. Decimal labels will be a sample or feature value.
- For charts using DataSets with multiple Routines, consider using the variables ~cellsamp,label~ or ~cellsamp,filter,[a-z]~. Otherwise, the chart axis label text may be returned as simply a column number rather than the Sample information. See the topic Measurement Data Variables for more information on these variables.
- Both Text and Decimal labels produce the same results for vertical axes.
Can we improve this topic?