Graphs are annotation that perform calculations and present data in pre-designed graphs.
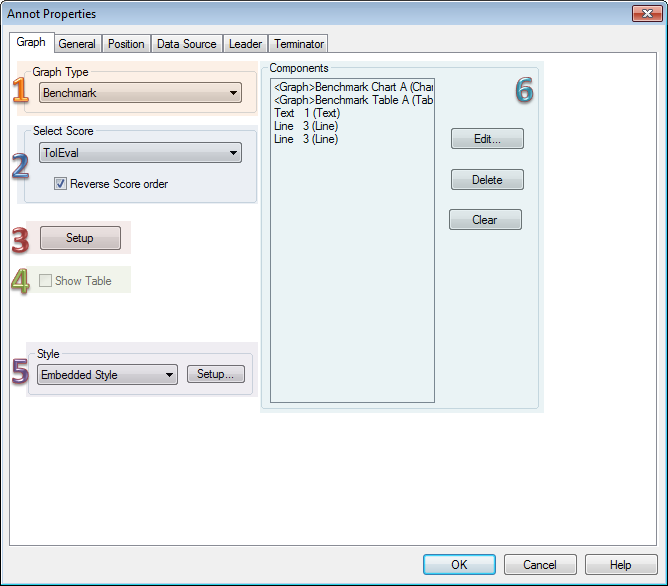
1. Graph Type
In the Graph Type section of the Annot Properties dialog, choose the type of graph to display by selecting the name from the dropdown menu.
|
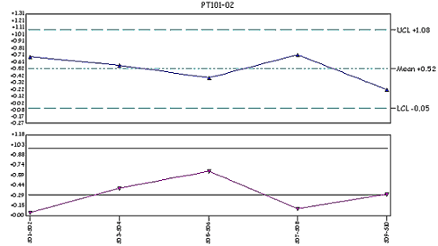
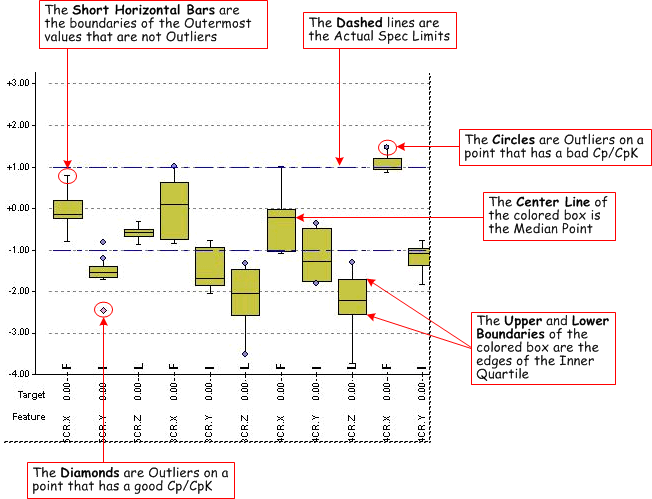
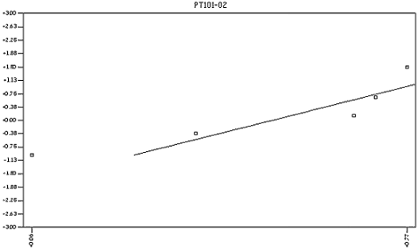
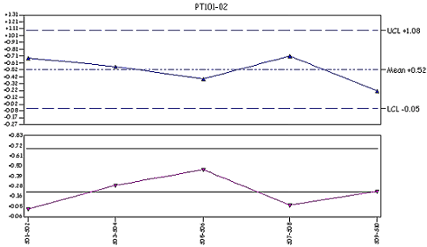
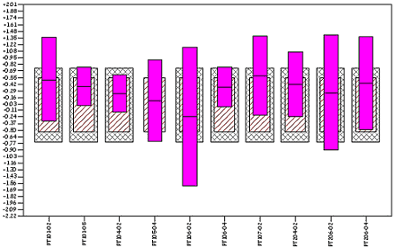
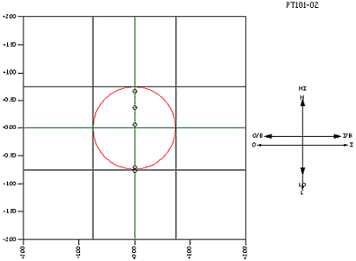
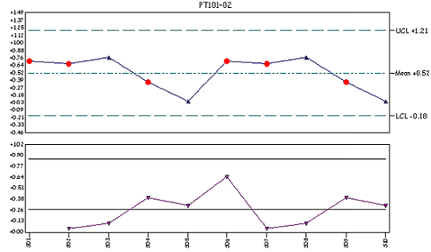
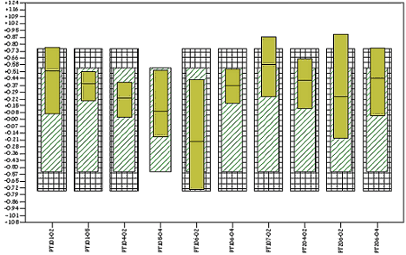
Click the Graph names below to view/hide an example of the graph type: |
||
TrendTrend
|
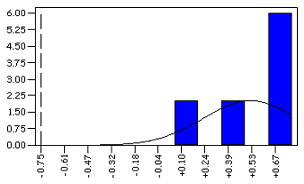
HistogramHistogram
|
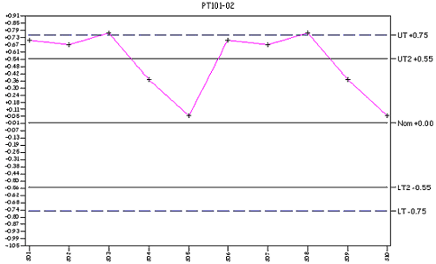
BenchmarkBenchmark
|
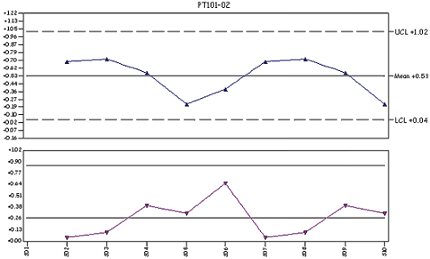
XBar-RXBar-R
|
Box & WhiskerBox & Whisker
|
Normal ProbabilityNormal Probability
|
XBar-SXBar-S
|
Six SigmaSix Sigma
|
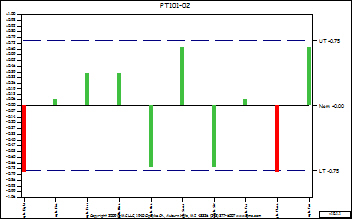
TargetTarget
|
X-MRX-MR
|
RangeRange
|
|
MA-MRMA-MR
|
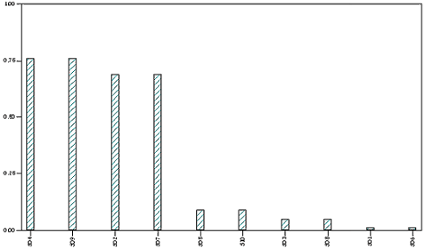
ParetoPareto
|
BarBar
|

2. Select Score
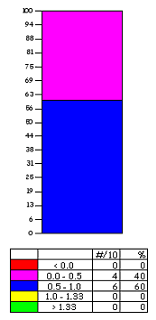
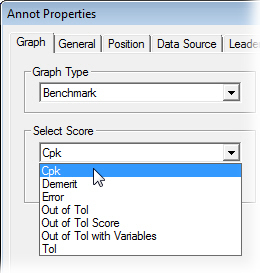
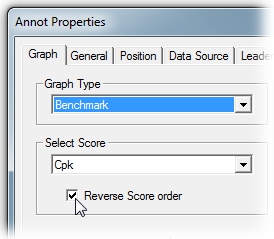
If you are creating a Benchmark or Bar graph, select a score from the drop down list of available Scores. For more information about Scores and how to create them, please refer to the topic Scores.
Reverse Score Order
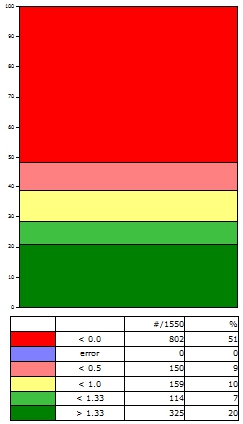
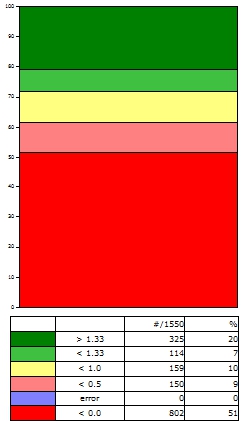
When the Reverse Score Order check box is selected, the order of the score applied to the graph will be reversed so that information that was previously presented first will now be presented last in the graph. This option is available for Benchmark Graph types only.
3. Setup
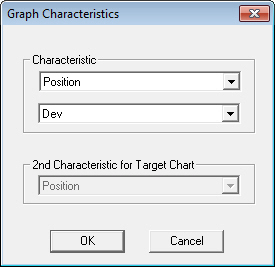
Select the characteristics you would like to apply from the menus. If you are creating a Target chart, a secondary characteristic option will become available for selection.
4. Show Table
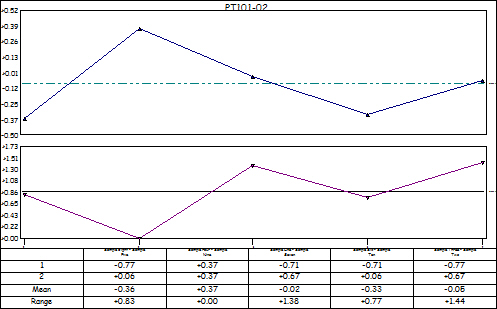
The Show Table check box will only be enabled for graph types that use subgroups. You can select the Show Table feature in order to display a customizable table beneath the graph which will contain useful information regarding subgroup data values. To access the Table Properties of a Graph, put the graph in edit mode and select Properties from the right-click menu.
XBar-R Graph with Show Table enabled:
5. Style
Click Style to open the Style Properties to modify the Styles of the Graph..
6. Components
The Components section of the Annot Properties dialog lists all of the sub-annot contained within the graph annot object.
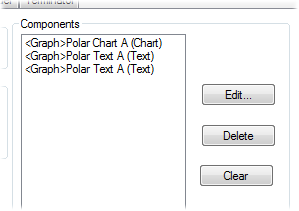
Edit
Select which graph you want to edit and click the Edit button. The Annot Properties dialog will appear.
Delete
Select the graph to be deleted and click the Delete button.
Clear
Clicking the Clear button will remove any the graphs that are in the Components list.