Spectrum
The Spectrum functionality allows you to visualize actual data by changing feature markers to indicate data states. Spectrum evaluates the data in the DataSet assigned as the Views' DataSource. The evaluation is performed using a variable or expression, the results of which are then sorted into nodes (i.e., bins) according to the properties of the Nodes. Each Node has its own variable or expression that is used by Spectrum to find the qualifying data and to assign a Style to the marker to indicate the end result.
The setup of Spectrum Nodes is a concept similar to how Bins are setup for Scores.
Any CM4D Variables or expressions can be used for the Spectrum Text and Node Text. These variables/expressions are resolved the same way as in any other area of CM4D.
- Variables resolve data, such as deviation or mean.
- Expressions are used to show things like near-limit states, such as within a percentage of tolerance.
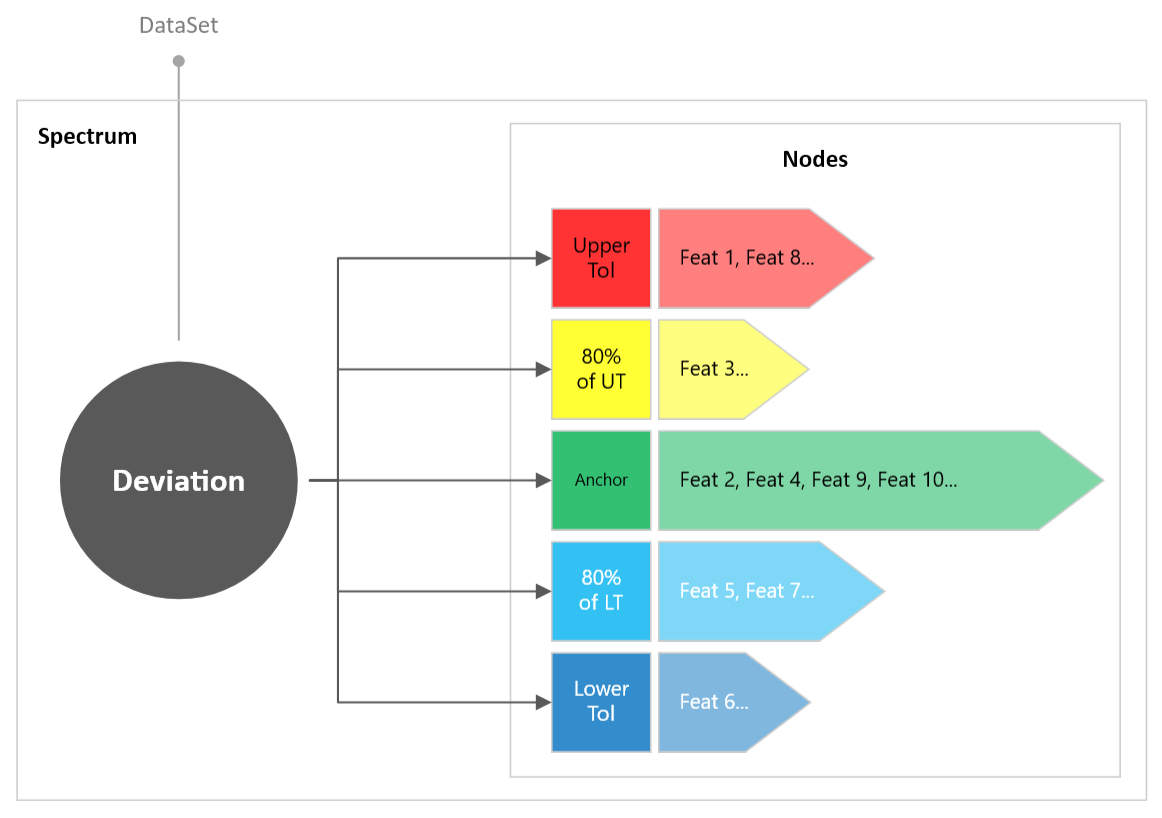
Diagram of a Spectrum example setup for ~dev~ values and nodes for tolerance states.
To see the setup area for Spectrum, see the topic View Annotation Properties.
Spectrum Usage Scenarios
Some common usage scenarios for the Spectrum functionality:
- Extent of Deviation - Use exaggerated arrows to show the extent of deviation.
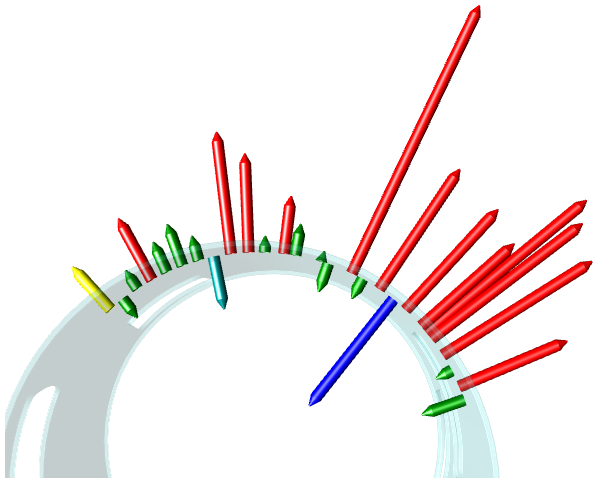
Spectrum Errows - Extent of Deviation
- Heatmap of Deviation - Color markers by deviation values on the surface of a part.
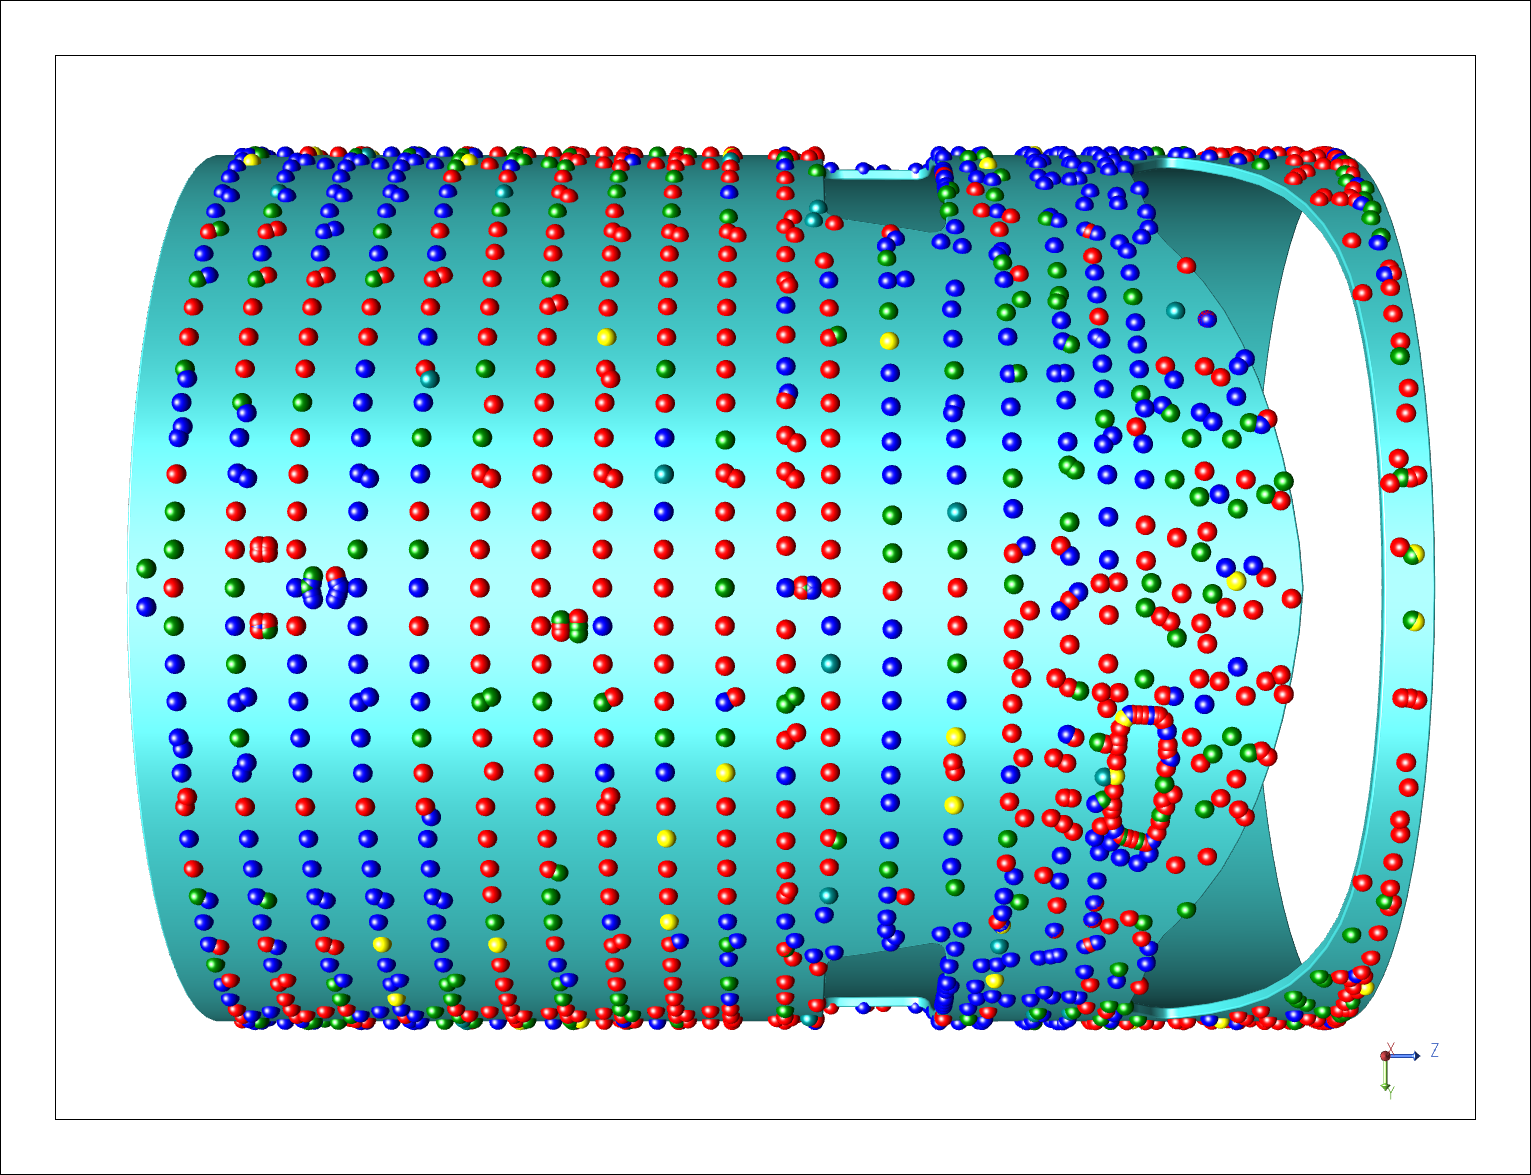
Spectrum Color - Heatmap (Surface)
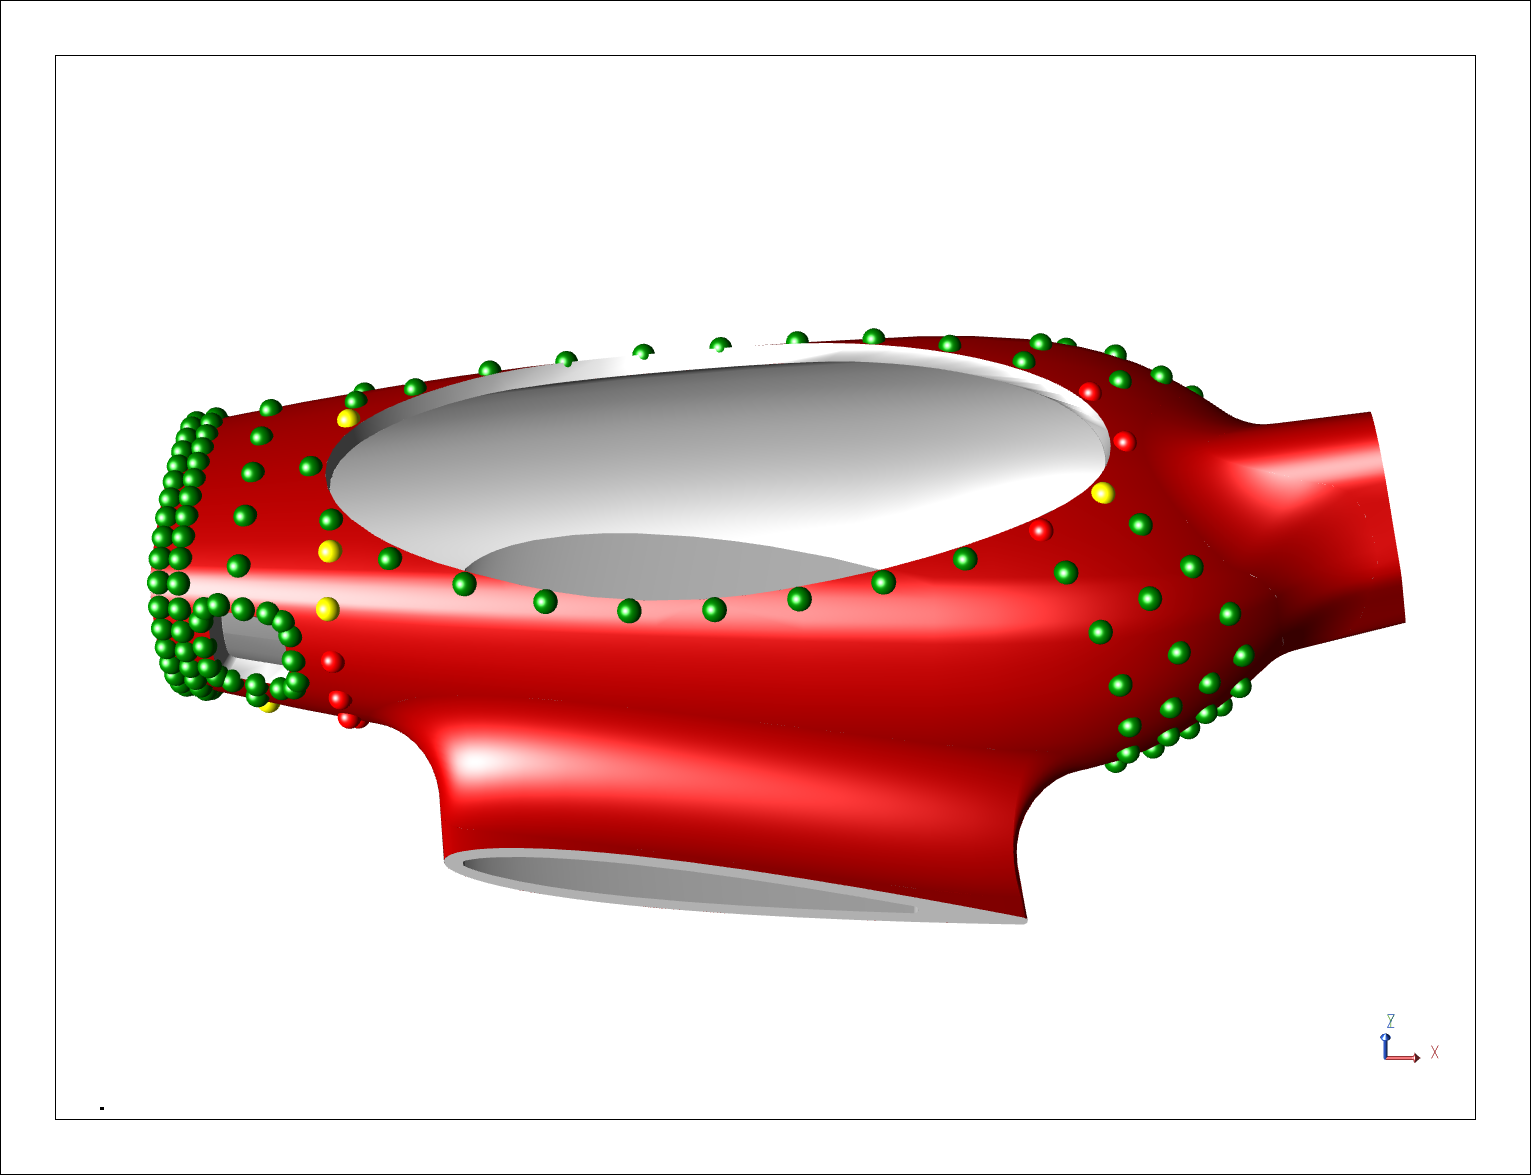
Spectrum Color - Heatmap (Holes)
- Heatmap of Statistics - Calculate Cp/Cpk, 6 Sigma, Mean, Range, etc., and display as a heatmap by changing the color of the markers according to the results.
- Part Matching - See the deviations of two individual parts and compare how those deviations compare for the mating parts. When used in conjunction with CM4D's Alignment functionality, the alignment results are visually enhanced to indicate the alignment results.
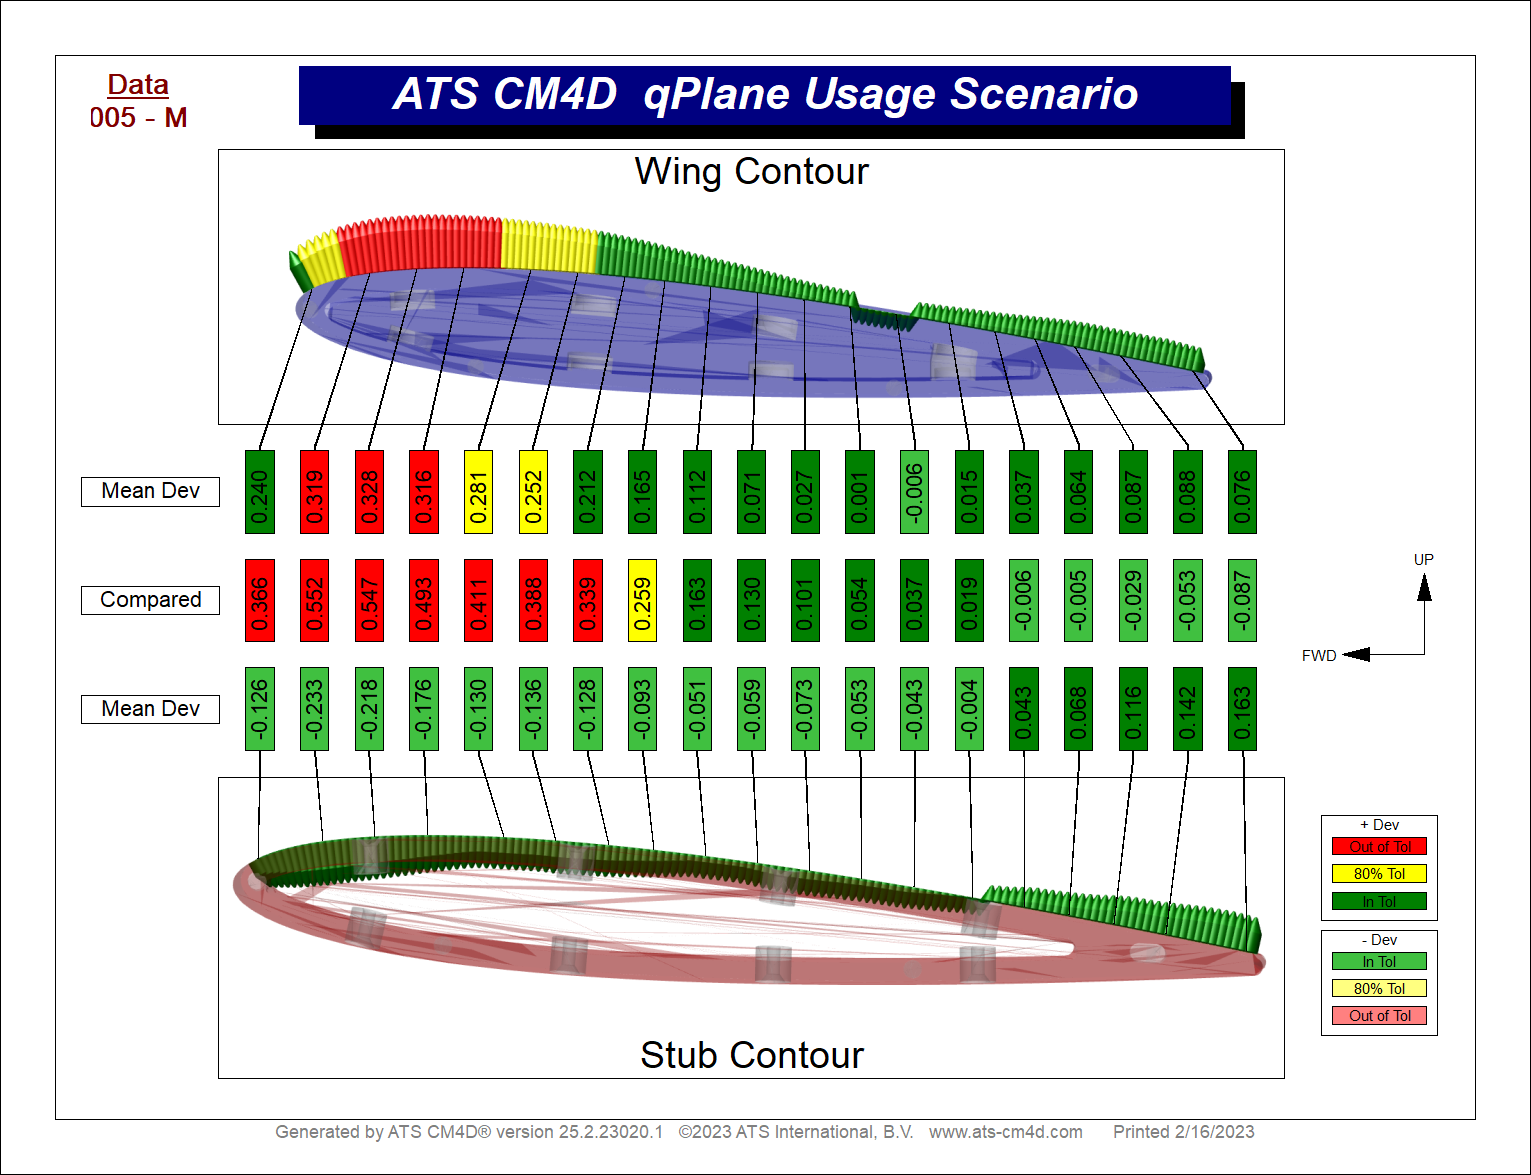
Spectrum Errows - Part Matching Contour
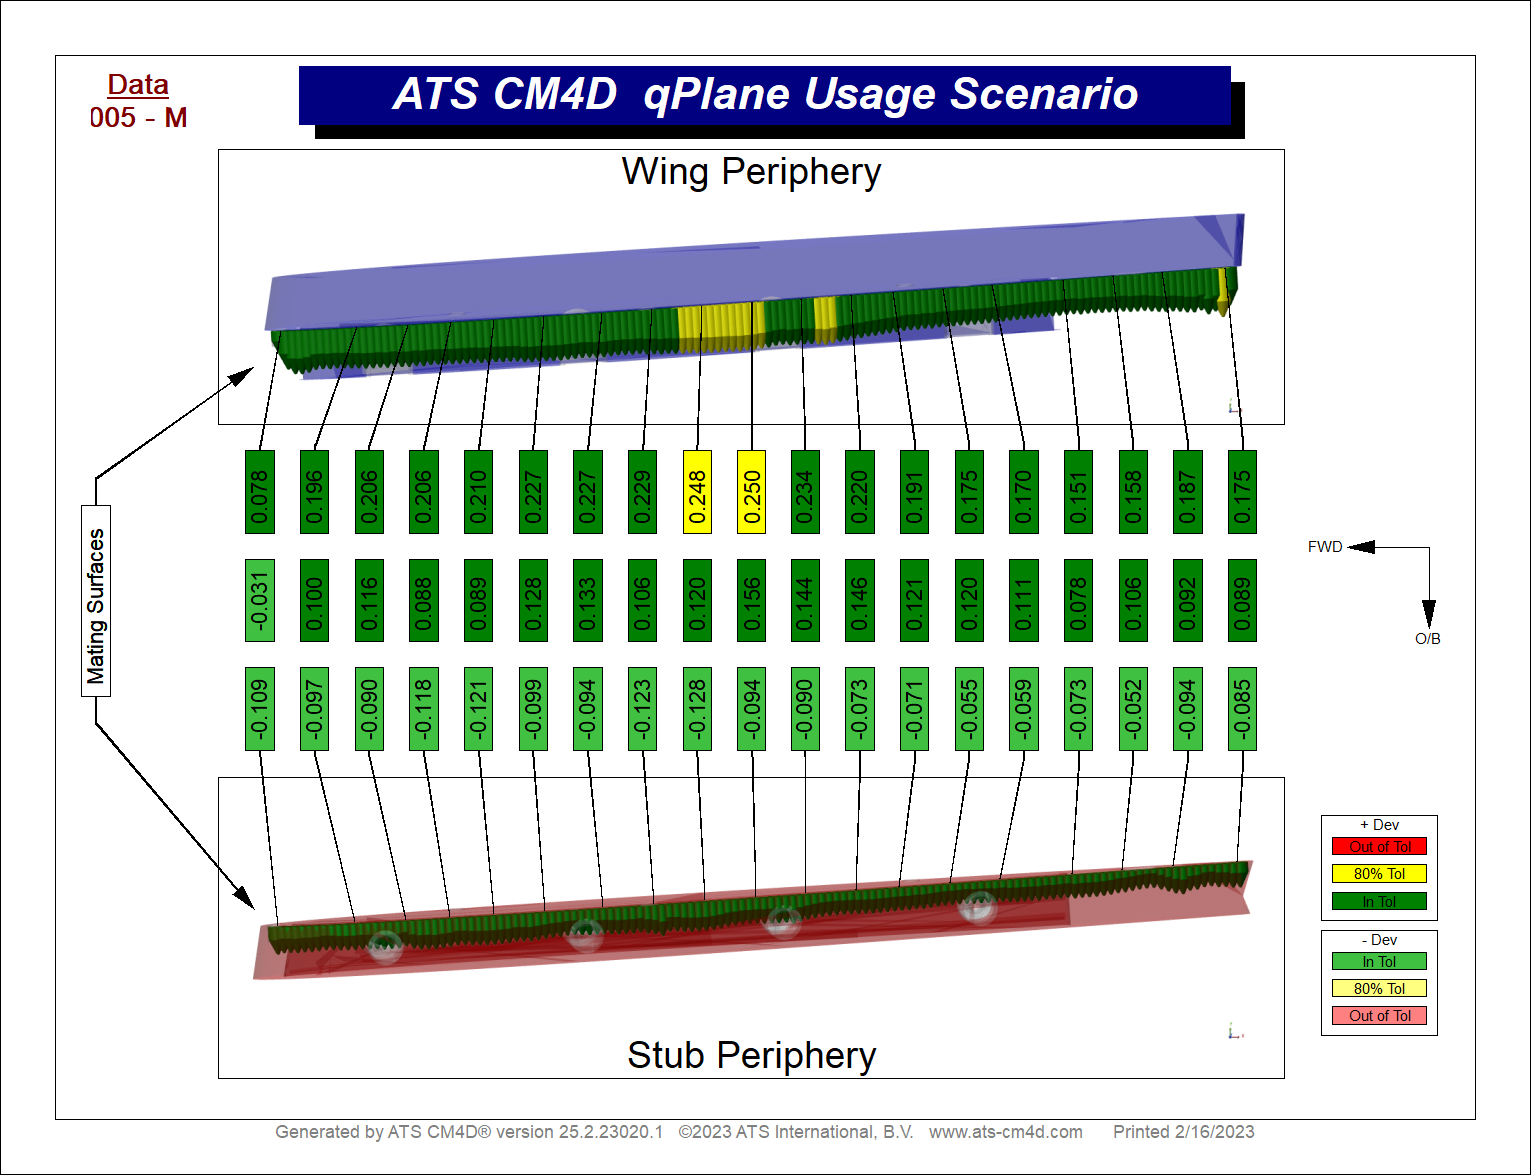
Spectrum Errows - Part Matching Periphery
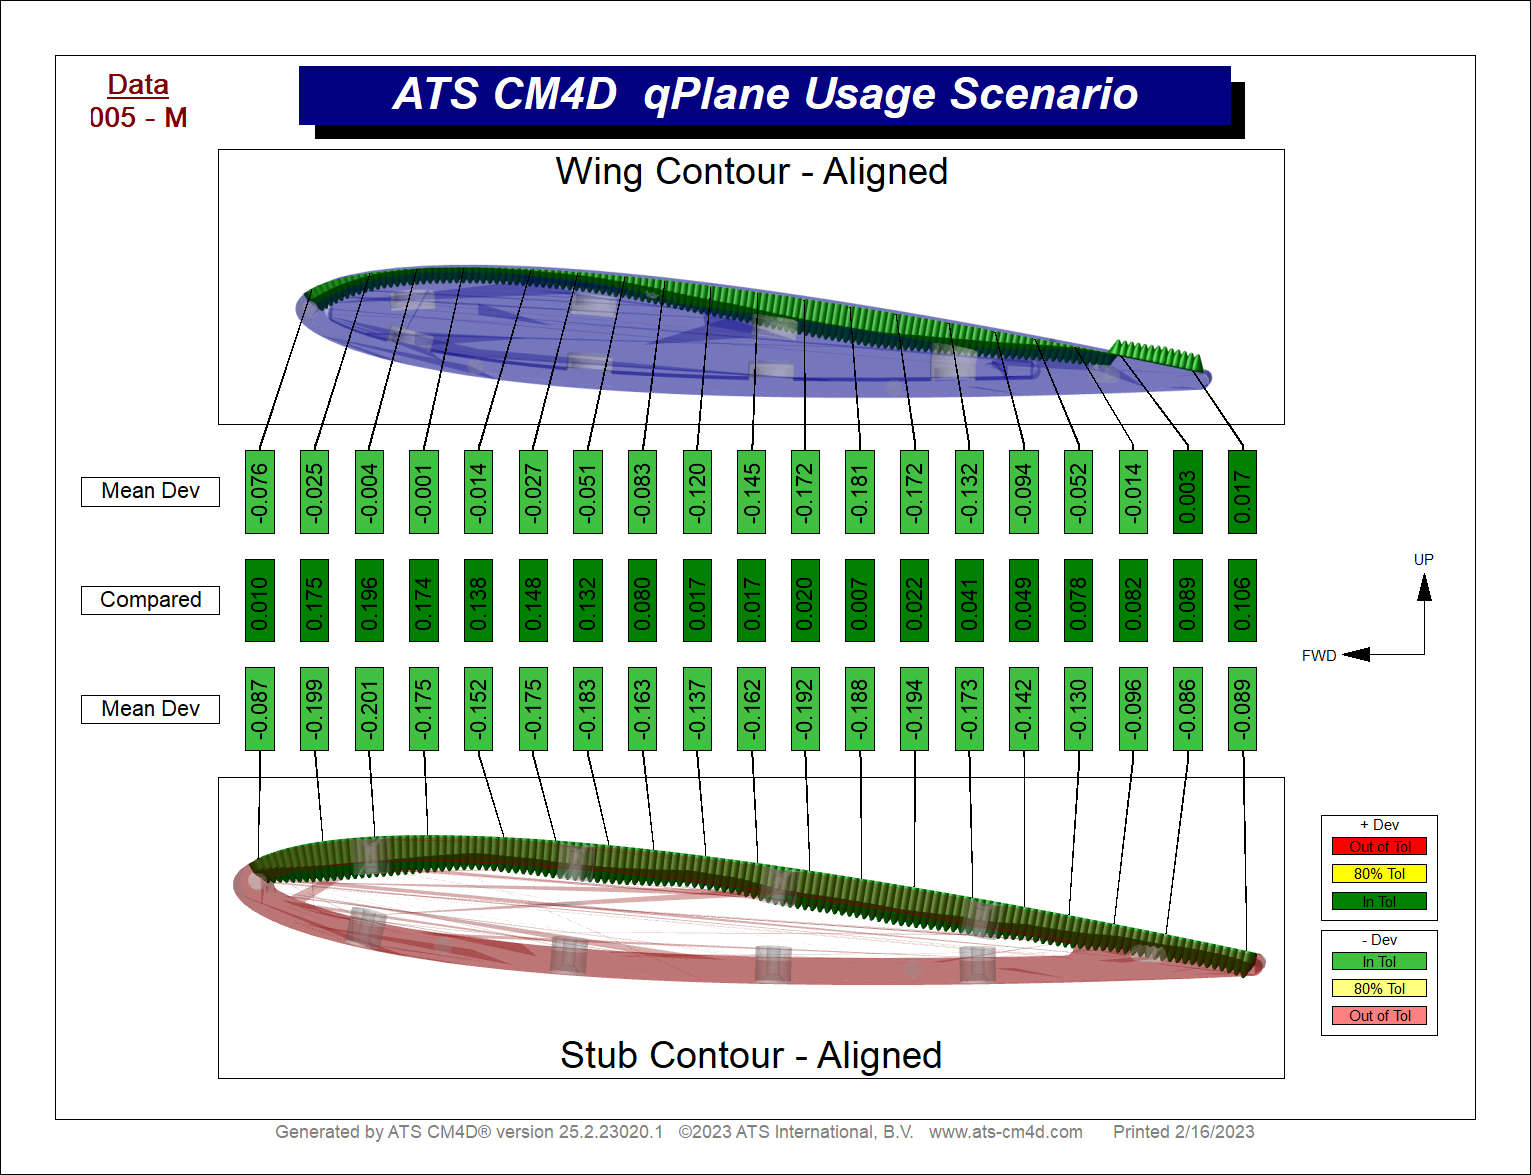
Spectrum Errows - Part Matching Contour (Aligned)
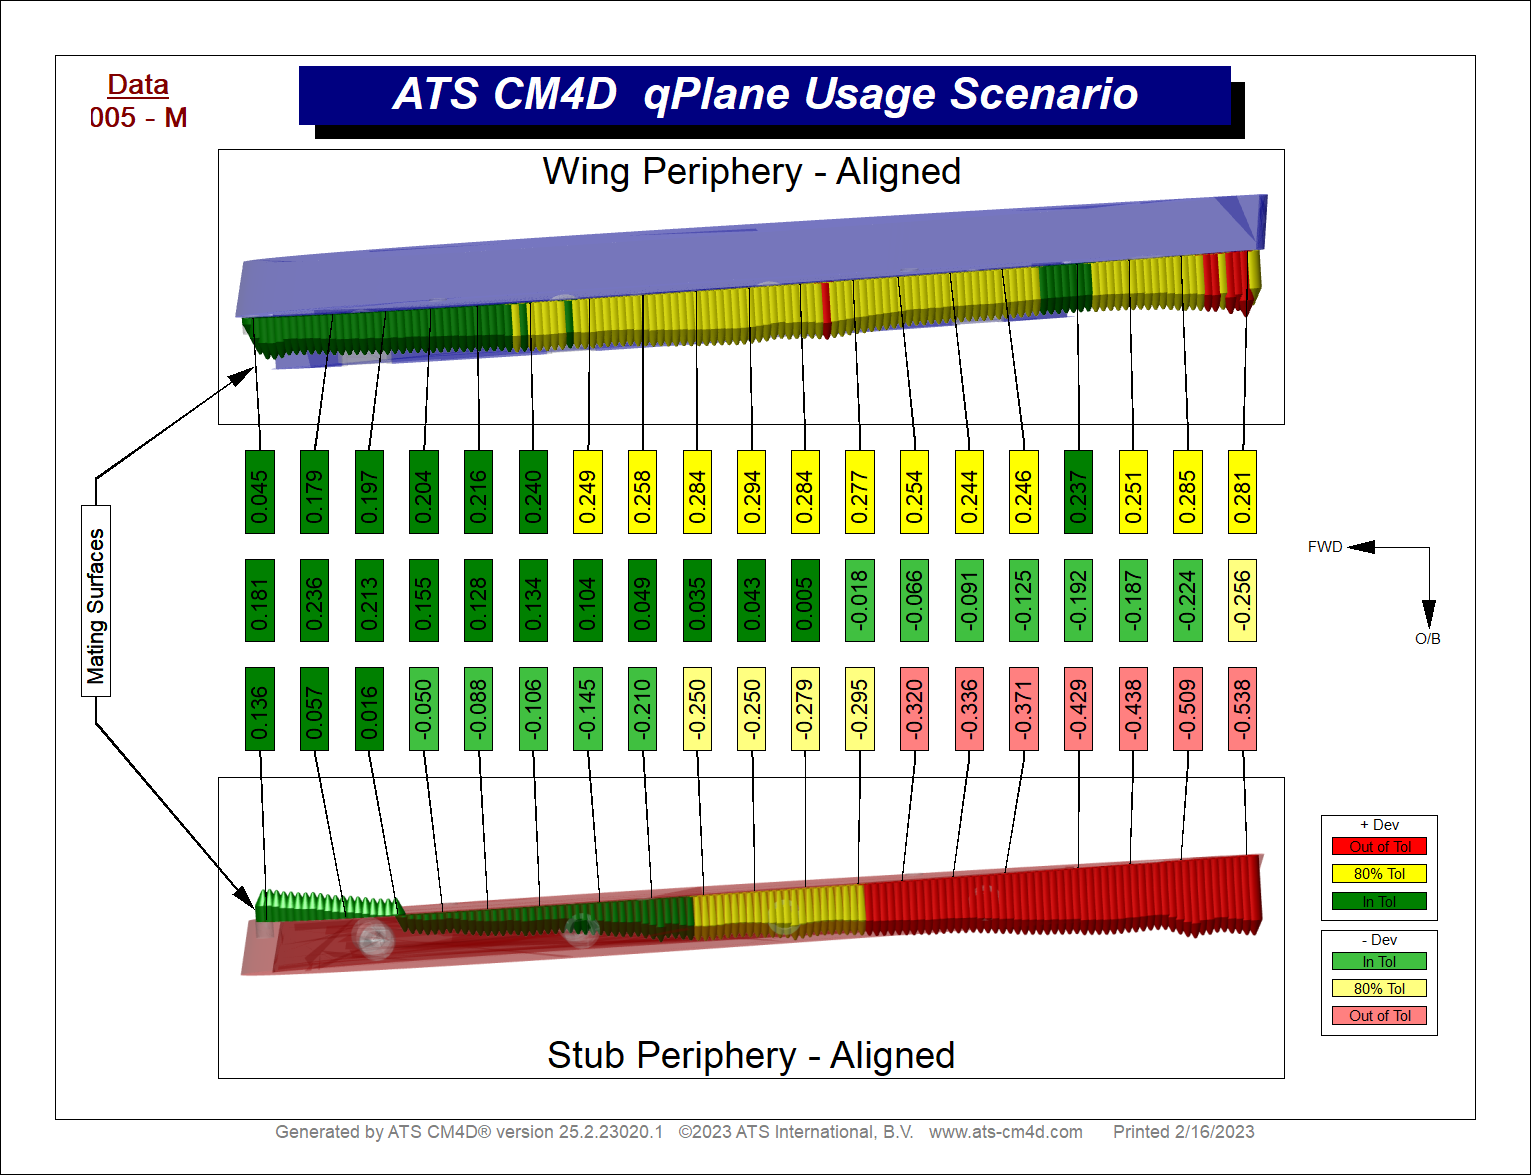
Spectrum Errows - Part Matching Periphery (Aligned)
- Surface Topography - Visualize micron differences across the surface of individual elements, then show the impact of the removal on the entire assembly.
- Visualization of Deviation - Show deviation by changes in marker color/length/direction along the edge of a part.
Data Requirements
While most data can be used with Spectrum, there are a few things to keep in mind when selecting a DataSet:
- If your data does not have IJK, a default vector (IJK 0,0,1) is applied.
- Features without XYZ characteristics (such as Distance, Range, or Polar) are not supported for the Spectrum types Errows and Vector.
Spectrum Types
Spectrum provides three different methods for drawing the Feature Markers: Color, Errows or Vector.
Color
This type is used in the Heatmap scenarios, where only the marker color is modified according to the resolved data.
Spectrum Type: Color (Surface Features
All feature markers are colored based on the selected spectrum node and the brush color of the style assigned to the node. The feature marker shape is displayed according to the Feature Marker Mode selected (Feature Specific or Sphere).
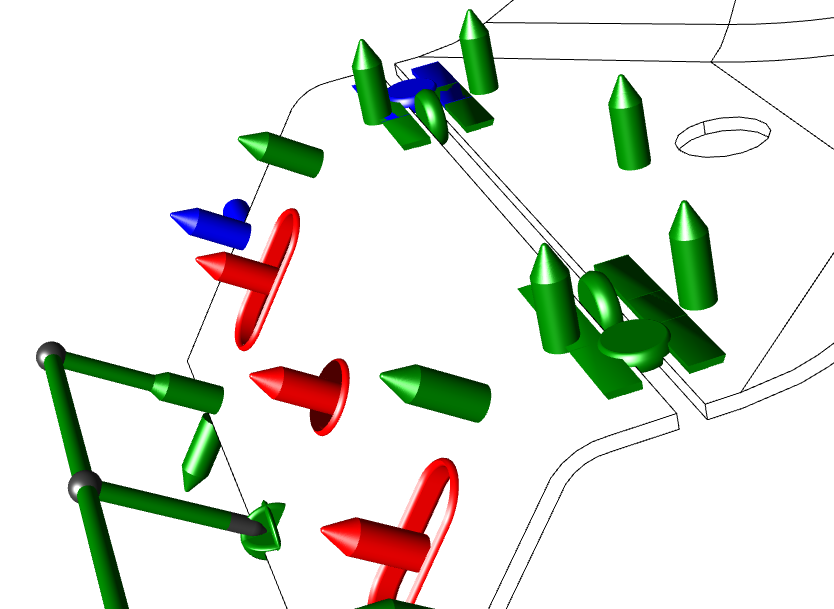
Spectrum Type: Color with multiple Feature Types (Feature Mode - Feature Specific) |
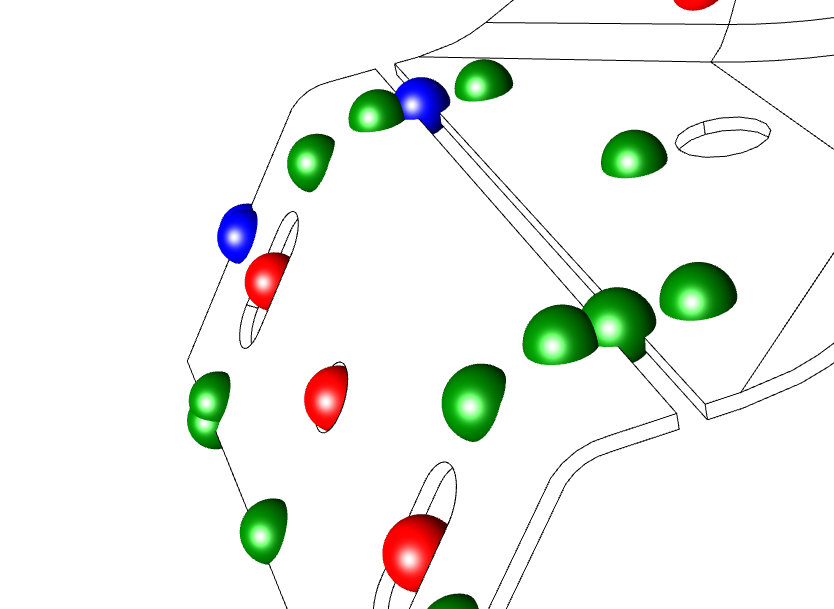
Spectrum Type: Color with multiple Feature Types (Feature Mode - Sphere) |
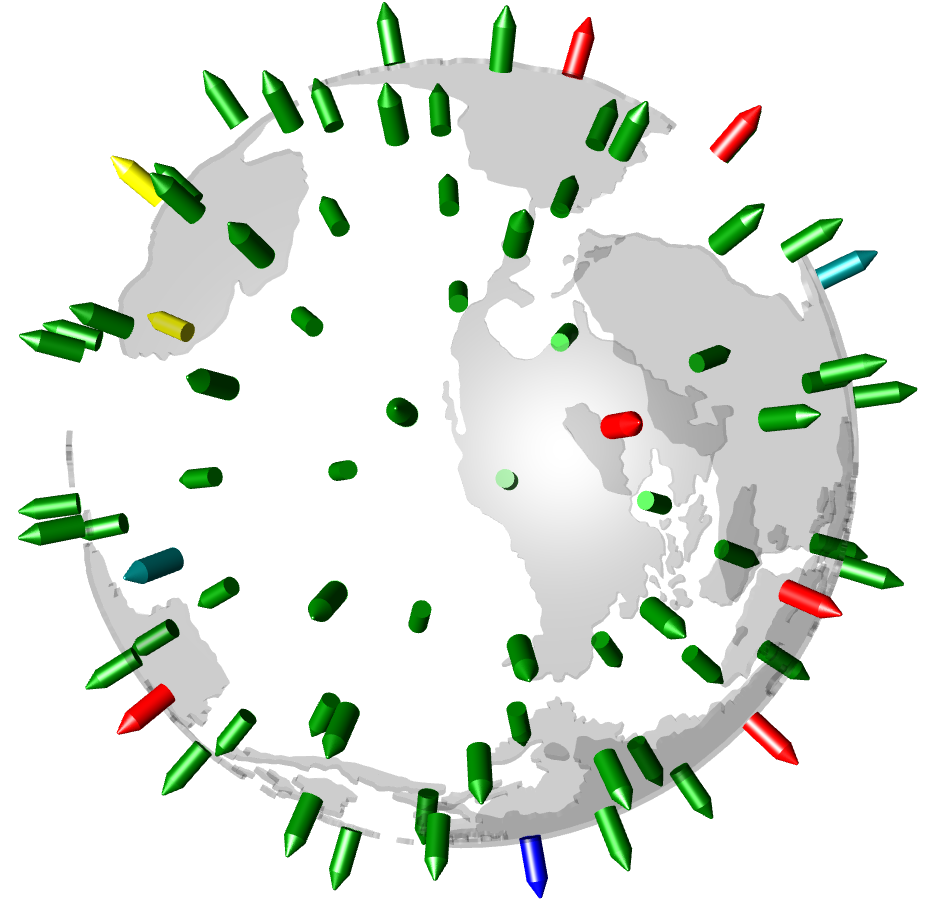
Errows
This type may be used in exaggerated deviation, surface topography or visualization of deviation scenarios, where the marker color is changed according to the resolved data along with the length and direction of the marker is adjusted according to the vector. The markers are drawn in the direction of the vector.
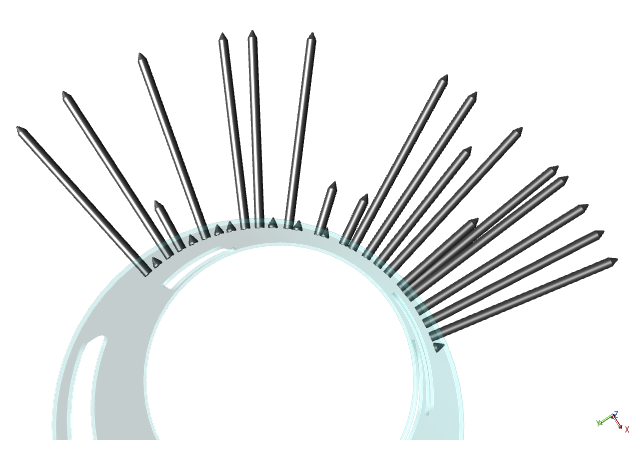
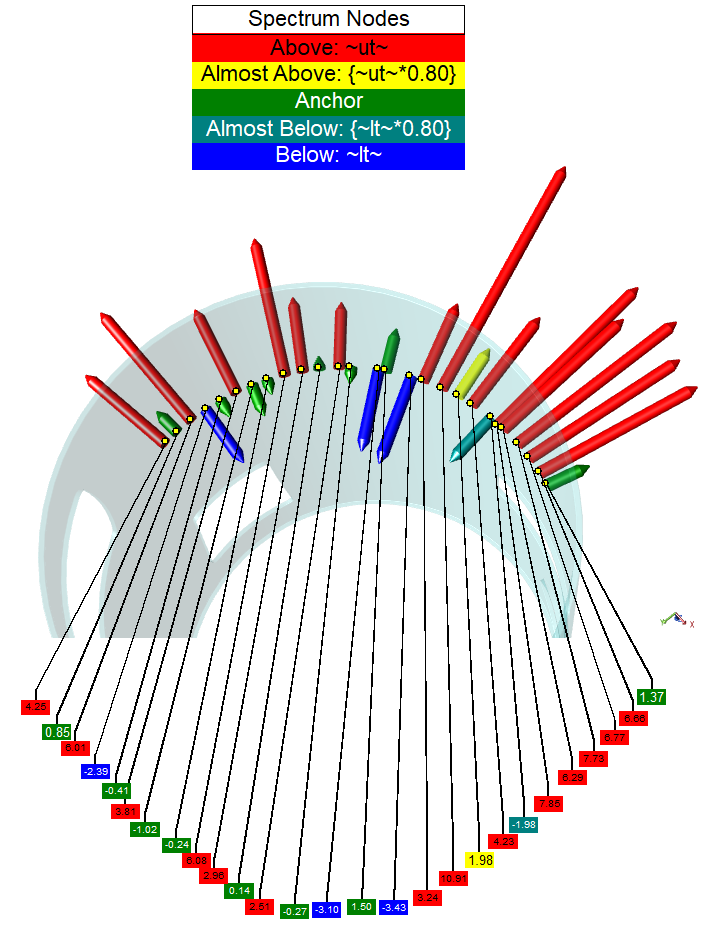
Spectrum Type: Errows
All feature markers are displayed with the Surface feature marker (a cone atop a cylinder). The length of the marker is calculated as the value multiplied by the Vector Length specified in the Spectrum Node property, divided by the default marker size.
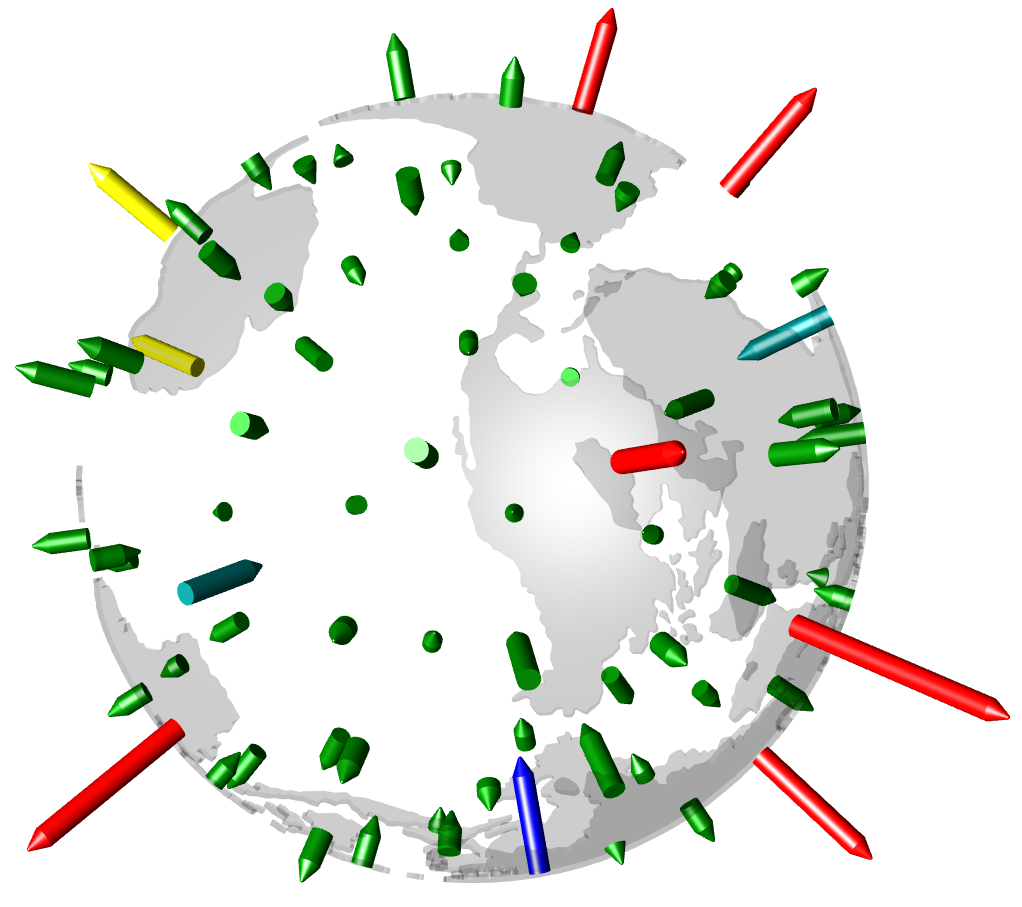
Vector
This type may be used in extent of deviation scenarios, where the marker length is exaggerated by assigning a marker length according to the specified data state for the node.
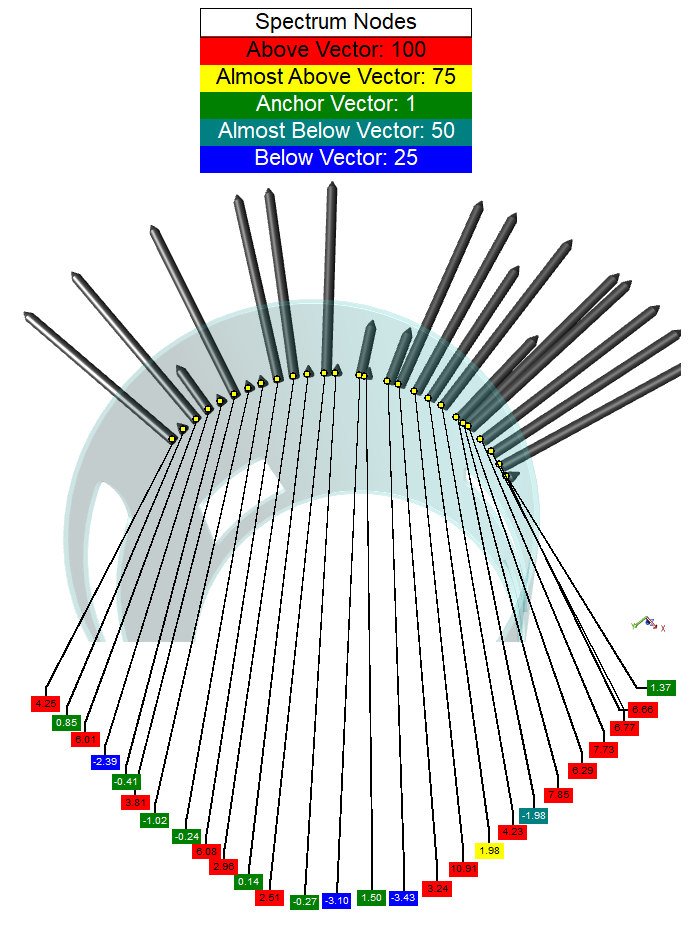
Spectrum Type: Vector
All feature markers are displayed with the Surface feature marker (a cone atop a cylinder). The length of the marker is determined by the Vector Length specified in the Spectrum Node property divided by the default marker size.
Errows vs. Vector
Errows use a Style and feature vector data to color and orient the feature markers. |
Vector uses the default marker color and the Vector Length provided in the Node property to draw the marker. |
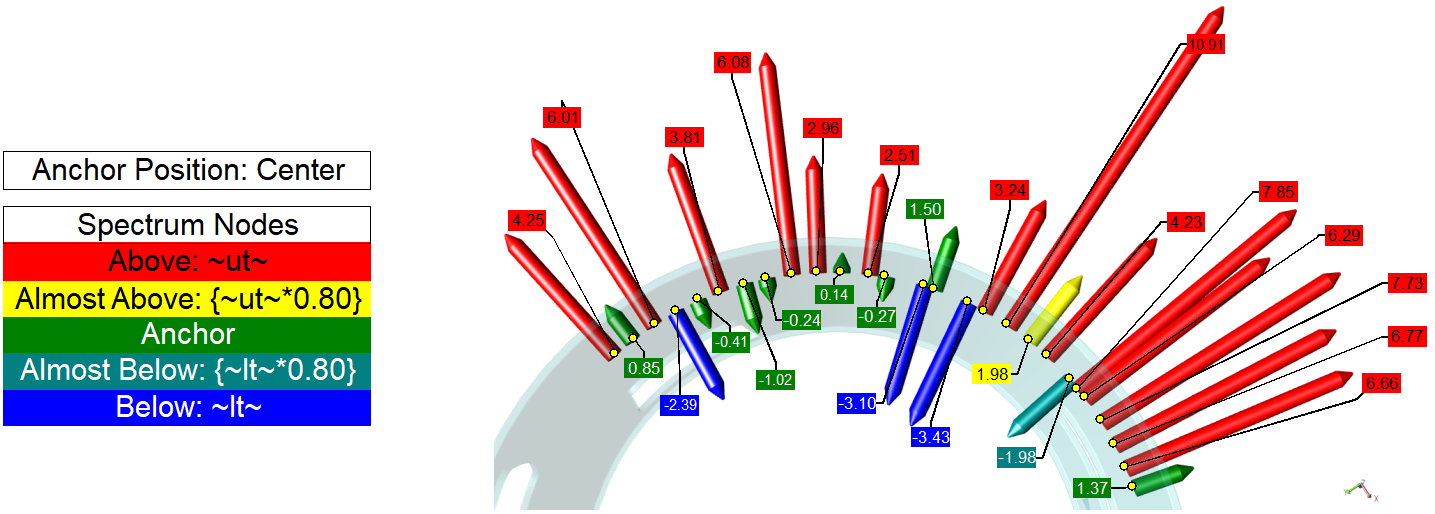
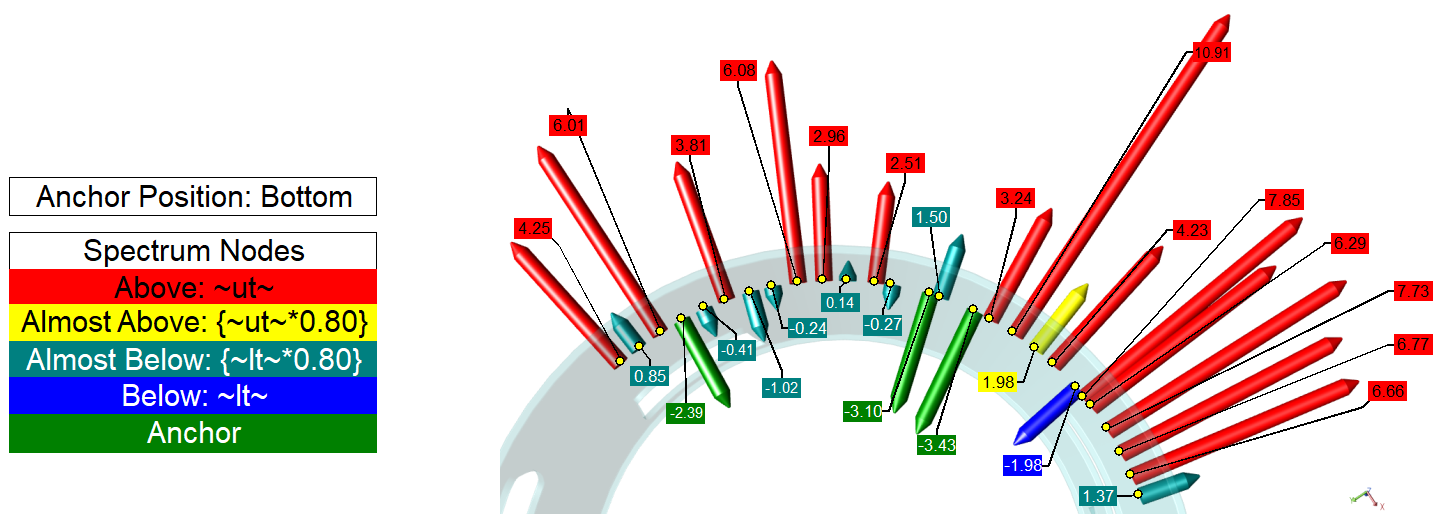
Anchor Position
The anchor position references where the Anchor Node is in the order. The position selected is important as it effects how the data is sorted into the Nodes and can change the resulting color.
The Anchor Position is comparable to the position of the Start Bin in Scores.
The following examples show the different anchor positions using the same data (text annotation use scores for styles that have the same setup as the Spectrum nodes).
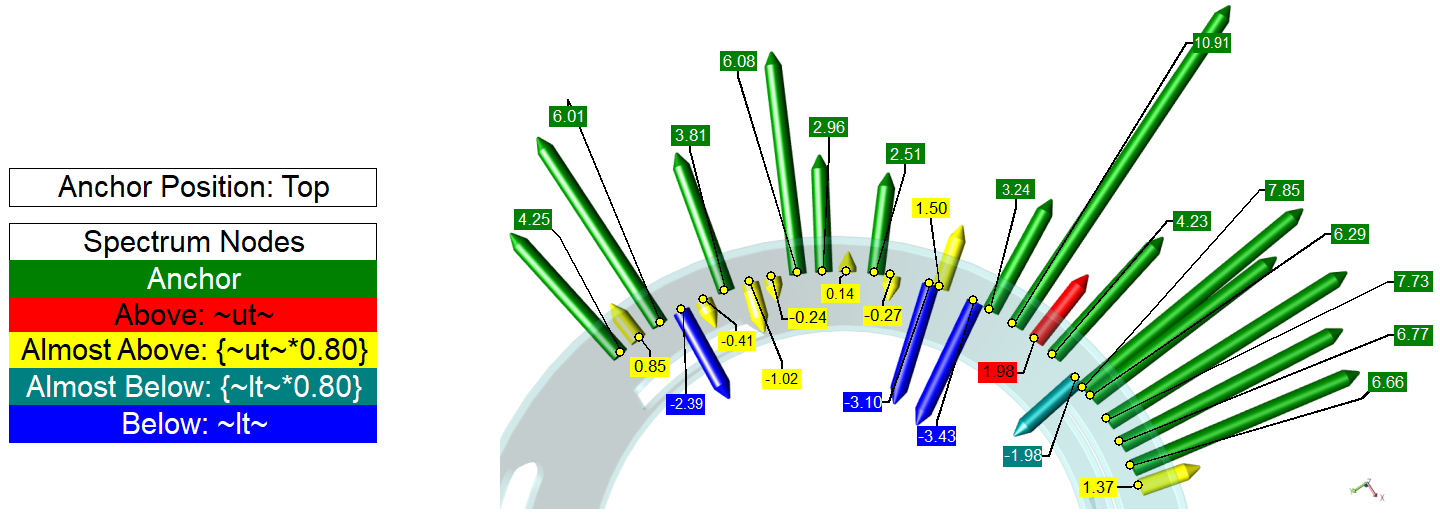
Anchor Position Top sorts Nodes like the Score Start Bin Highest |
Anchor Position Top sorts Nodes like the Score Start Bin Zero |
Anchor Position Top sorts Nodes like the Score Start Bin Lowest |
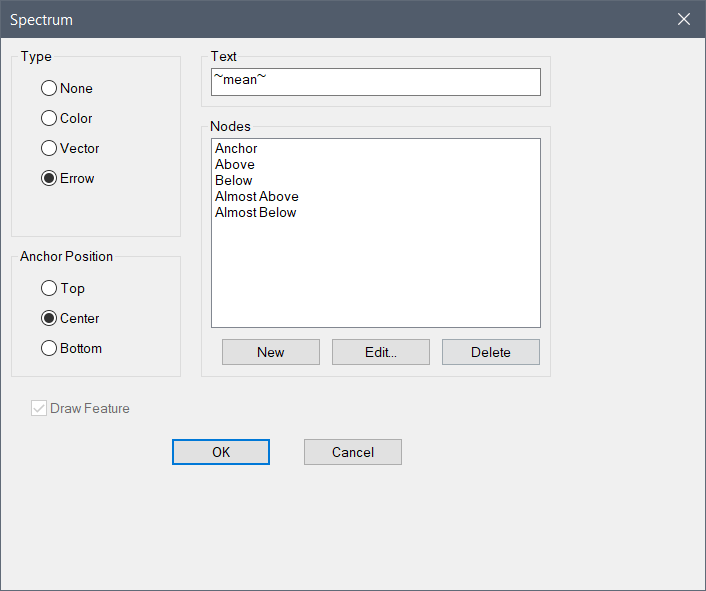
Spectrum Setup
Spectrum is a property of the View Annotation.
See also, View Annotation Properties.
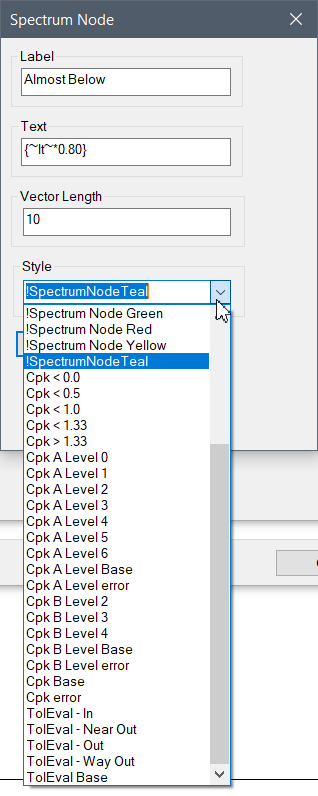
Spectrum Node Styles
Custom color styles are applied to the feature marker to indicate the state of the resolved data. Styles used by Spectrum Nodes are Document Styles, either default styles or user-defined styles.
Spectrum Node Styles List |
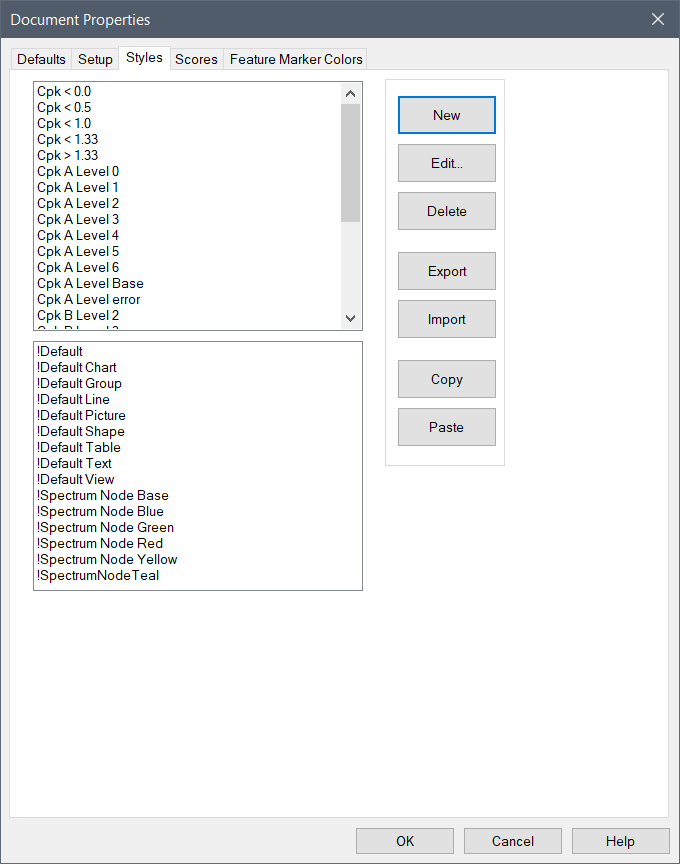
CM4D Document Styles |
To create new styles, see the following topics:
Build Example Scores and Styles
Example Setup
In the following example, the different Spectrum Types are compared to show how the settings effect the end result.
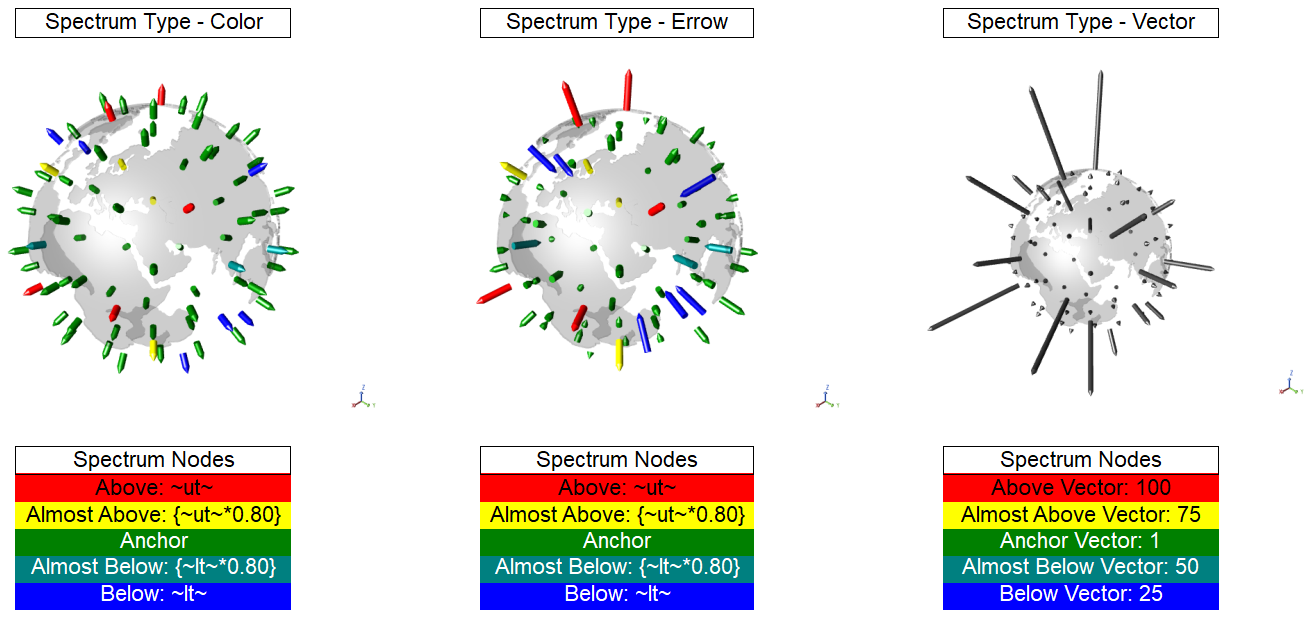

Example Setup Properties - Errows/Color
| DataSet Properties | Spectrum Settings | Spectrum Nodes | ||||
| Sift Rules | Surface - Normal | Type | Errow | Anchor | Text | n/a |
| Vector Length | 10 | |||||
|
Style |
!Spectrum Node Green | |||||
| Samples | Active Sample | Anchor Position | Center | Above | Text | ~ut~ |
| Vector Length | 10 | |||||
| Style | !Spectrum Node Red | |||||
| Features | All Features | Text | ~mean~ | Below | Text | |
| Vector Length | 10 | |||||
| Style | !Spectrum Node Blue | |||||
| Nodes | Anchor Above Below Almost Above Almost Below |
Almost Above | Text | |||
| Vector Length | 10 | |||||
| Style | !Spectrum Node Yellow | |||||
| Almost Below | Text | |||||
| Vector Length | 10 | |||||
| Style | !Spectrum Node Teal | |||||
Example Setup Properties - Vector
| DataSet Properties | Spectrum Settings | Spectrum Nodes | ||||
| Sift Rules | Surface - Normal | Type | Vector | Anchor | Text | n/a |
| Vector Length | 1 | |||||
|
Style |
||||||
| Samples | Active Sample | Anchor Position | Center | Above | Text | ~ut~ |
| Vector Length | 10 | |||||
| Style | ||||||
| Features | All Features | Text | ~mean~ | Below | Text | |
| Vector Length | 5 | |||||
| Style | ||||||
| Nodes | Anchor Above Below Almost Above Almost Below |
Almost Above | Text | |||
| Vector Length | 75 | |||||
| Style | ||||||
| Almost Below | Text | |||||
| Vector Length | 25 | |||||
| Style | ||||||
Can we improve this topic?