Grid Panel
The Grid panel is a shared space along the bottom of the main viewer page for the five data grids: Routines, Features, Samples, Processes and Results. Use the grid headers to navigate between grids. Click on a Grid header to go to the specific grid. The active grid is indicated with different color. If the grid panel is currently collapsed, clicking any of the grid headers will expand the grid panel.
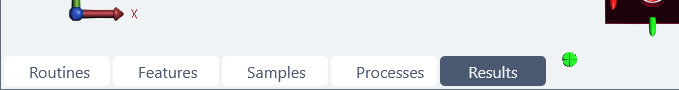
Grid Panels - Collapsed
If the Processes or Results grids appear to be missing specific data types, check your current selections in the Samples panel or selected Sieve. You may have settings applied that do not include those feature types or characteristics.
The grids are located at the bottom of the screen and can be expanded or collapsed as needed:
- Click on a Grid Header to open the grid panel; the header selected is the active grid in the panel.
- If the grid panel is already expanded, click a different grid header to switch to that grid.
- Click above the upper right corner of the grids to collapse the grid panel.
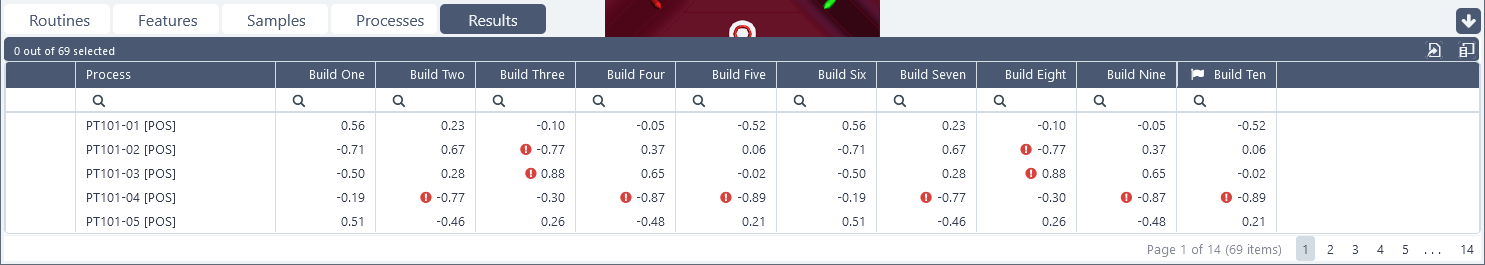
Grid Panels - Expanded
The Results Grid cells with a red exclamation icon contain data that is outside of specification limits.
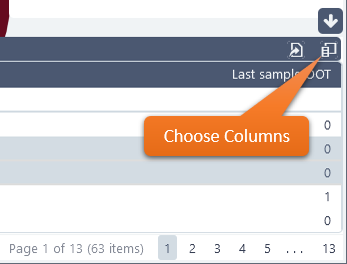
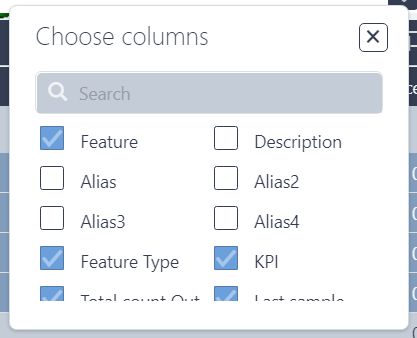
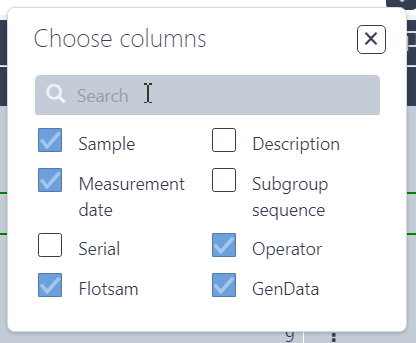
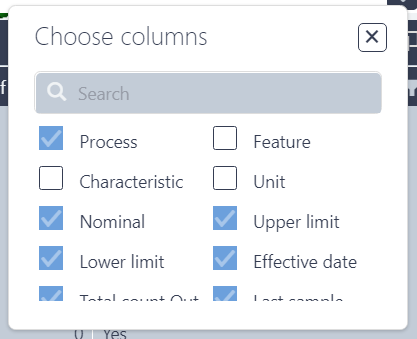
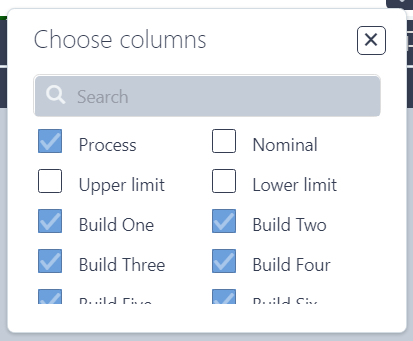
Choose Columns
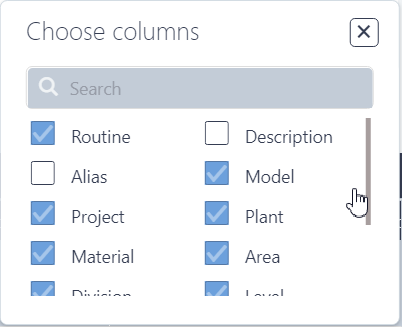
Grids are loaded with a number of default columns that cannot be removed, plus additional columns that can be added/removed. The column options in the popup is dependent on the currently active grid.
|
|
|
|
 Default Column - Cannot be removed
 Additional Column - Can be removed
To add or remove columns:
- Click
 to open the Choose Columns popup.
 - Check or uncheck a column to add or remove it from the data grid.
- Scroll through the list or use the search field to quickly find a column in the list.
 |
|
||||||||||||||||||||
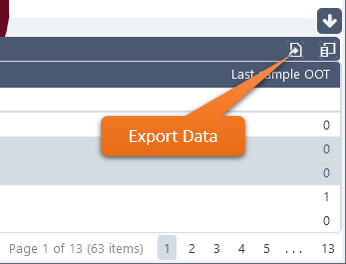
Export Data from Grids
Data loaded in the grids can be exported to an Excel file (*.xlsx). Filtering done on the grid-level does not effect the content of the export file.
 |
To see which columns are available, click There are two options for exporting data:
|
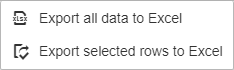 |
Microsoft Excel does not need to be installed (either locally or on the server host) to use the export grid function.
Grid and Model Synchronization
Selecting a row of data in the grid will also select the feature marker on the 3D model, selection corresponding rows in the grids or open a report in the Report Panel.
Selecting Feature Markers and Synchronizing the Grid and Report panels.
Selecting Data in Sequence
Selecting data in one grid effects what appears in the other grids.
For example, if you select a single Feature in the Feature Grid, then the other grids will only show the Samples, Processes and Results for the selected Feature.
Grid Controls
The grids have several built-in controls for finding or arranging data. All grid column headers can be used to sort, search or group data; some columns have an additional filter option. Check Grid Controls topic to see what can be combined, etc.
Right-click on the grid header for menu options.
Filter Column
Columns can be filtered to narrow down the data in the grids to specific types, according to the selected column. Click in the grid header to open the Filter options.
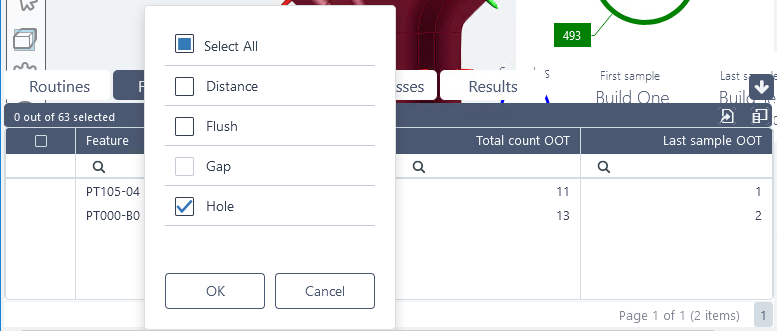
Filter popups are dynamic based on the column contents.
Group by Column
Columns may be grouped in order to organize the grid rows into a structural hierarchy. Each column that is grouped is designated as a node in the hierarchal tree and each successive column grouped is added as a subordinate of the previous column.
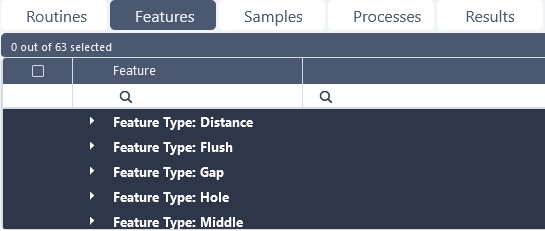
Grid grouped by Column, with Feature rows collapsed.
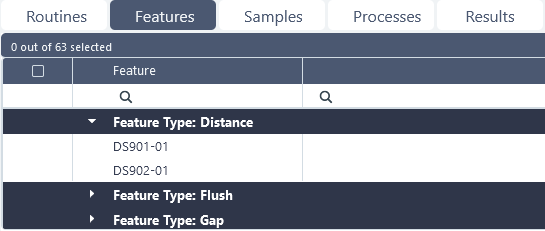
Grid grouped by column, with one Feature row expanded.
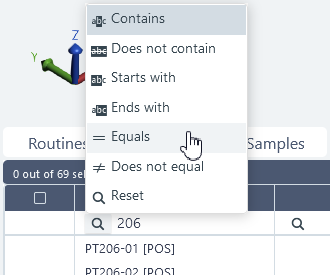
Search in Column
To search for something within a specific column, enter the string in the search field. This filtering is dynamic and will update the grid as you type. Each column can be searched with different text, but keep in mind that this search is composite, so if you type text into more than one column the data row must match all search strings in order to appear in the list.
 |
 |
Contains | Contains an exact or partial match of the text string within the field you selected for filtering. |
 |
Does not contain |
Does not contain an exact or partial match of the text string within the field you selected for filtering. |
|
 |
Does not equal | Does not match the value in the clause. | |
| Ends with | The entered string is an exact or partial match, starting with the end of the field. | ||
| Equals | Matches the value in the clause. | ||
 |
Reset | Returns the search field to its default state; deletes entered text and reverts the operator to the default 'Contains'. | |
 |
Starts with |
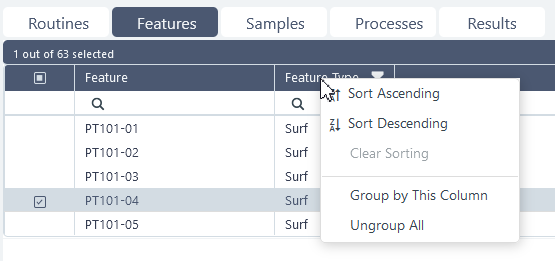
Sort by Column
Columns of the grid can be sorted by left-clicking on the header or right-clicking on the header and selecting an option from the context menu. Once sorted, the sort direction is indicated by and in the header. To remove the column sorting, right-click and select Clear Sorting from the menu.
- Sort Ascending
- Sort Descending
Keep/Remove Selected Rows
The data displayed in the grid can be filtered by selecting rows to keep or to remove. The corresponding feature markers are also hidden on the 3D model. The removed data is still loaded, but is hidden (in grids, 3D model, reports). All data can be shown again at any point.
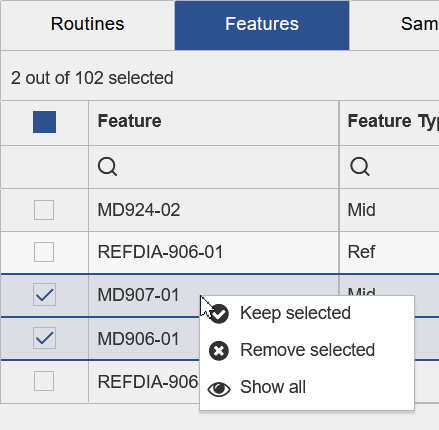 |
Keep Selected - Removes all rows except currently selected rows from the grid. Remove Selected - Removes only currently selected rows from the grid. Show All - Restores all data rows in the grid. |
Can we improve this topic?