Peruse User Interfaces
This topic describes the regions of the different CM4D Peruse web pages and interfaces.
Peruse Home Page
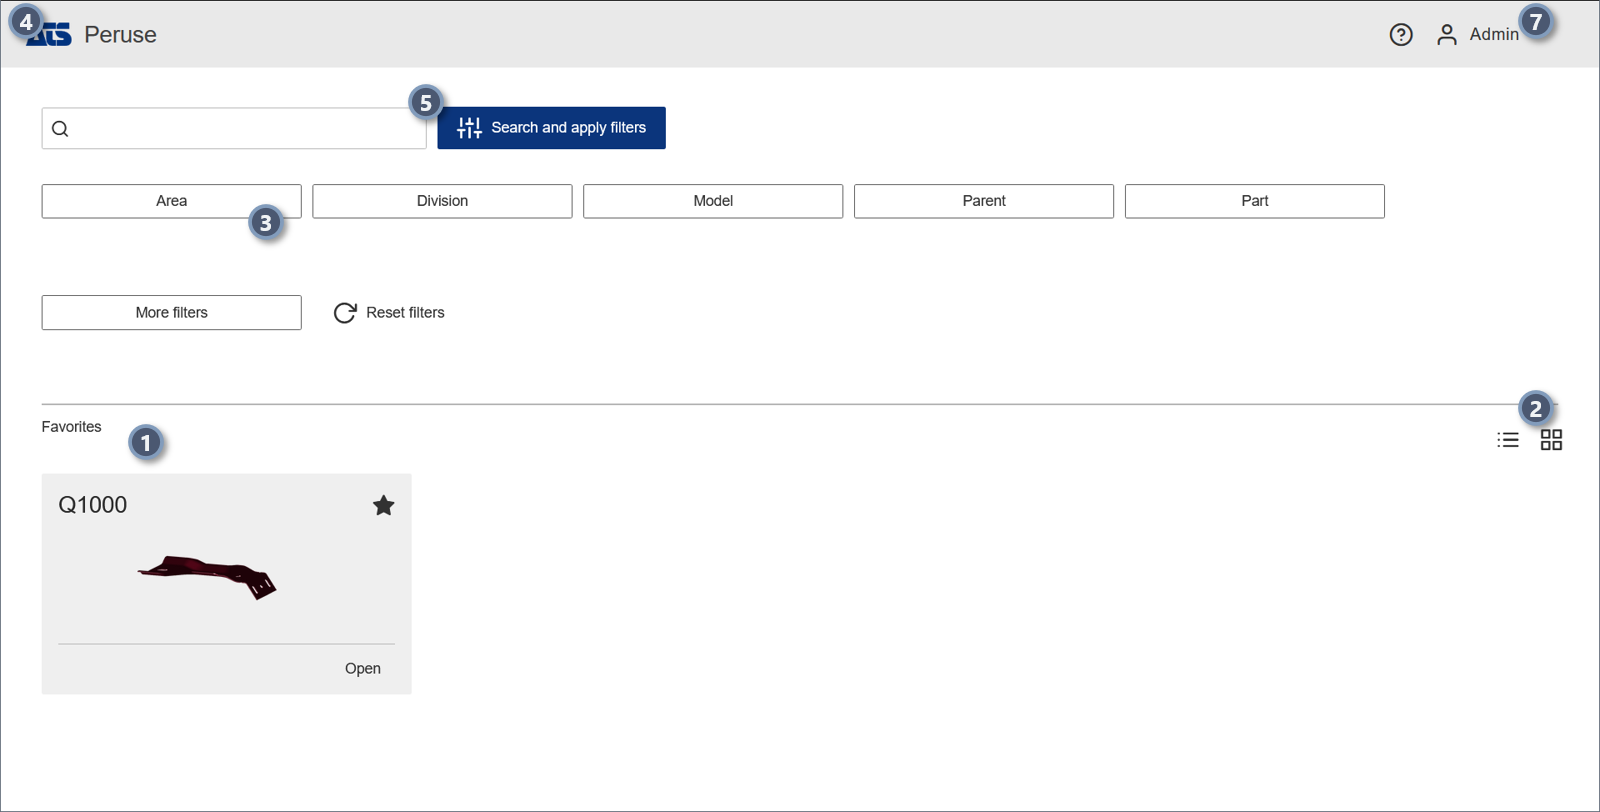
The Home page is the main landing page that includes a full-text search field, Routine Filters and shortcuts to any Routines you have marked as Favorites. You can return to this page from any other screen by clicking on the logo in the top left corner.
 |
||
| 1. Favorites | Routines can be marked as Favorites to appear as shortcuts on the home page. Once you have a favorite marked, you can select it from the home page to load the data directly into the viewer. This allows you to have quick access to data you access regularly without going through the search process every time. | |
| 2. Favorites Display | Favorites can be displayed as either tiles or a grid.
|
|
| 3. Filters | The scope of your search can be reduced by selecting options from available filters displayed as buttons along the top of the screen, including DataSources or Routine Filters. Once an initial search is executed, the filters are dynamic based on the search results. This means that if you enter text for the initial search, only filters (buttons and options within the filter popups) which also apply to the data found by the text string are shown on the Search Results page. Any changes to the filter selection triggers an automatic update to the search results. The DataSource filter menu is always available; Routine Filters are only displayed if the accessible data has Routine Filters assigned.
|
|
| 4. Home | Reload the Home page. | |
| 5. Search | Enter a text string identifying the data you want to find. This is a full-text search on Routine properties including labels, descriptions, filters or types. | |
| 7. User Options | User Options provide some settings that are apply to the logged in user and stored for subsequent sessions. | |
Peruse Search Results
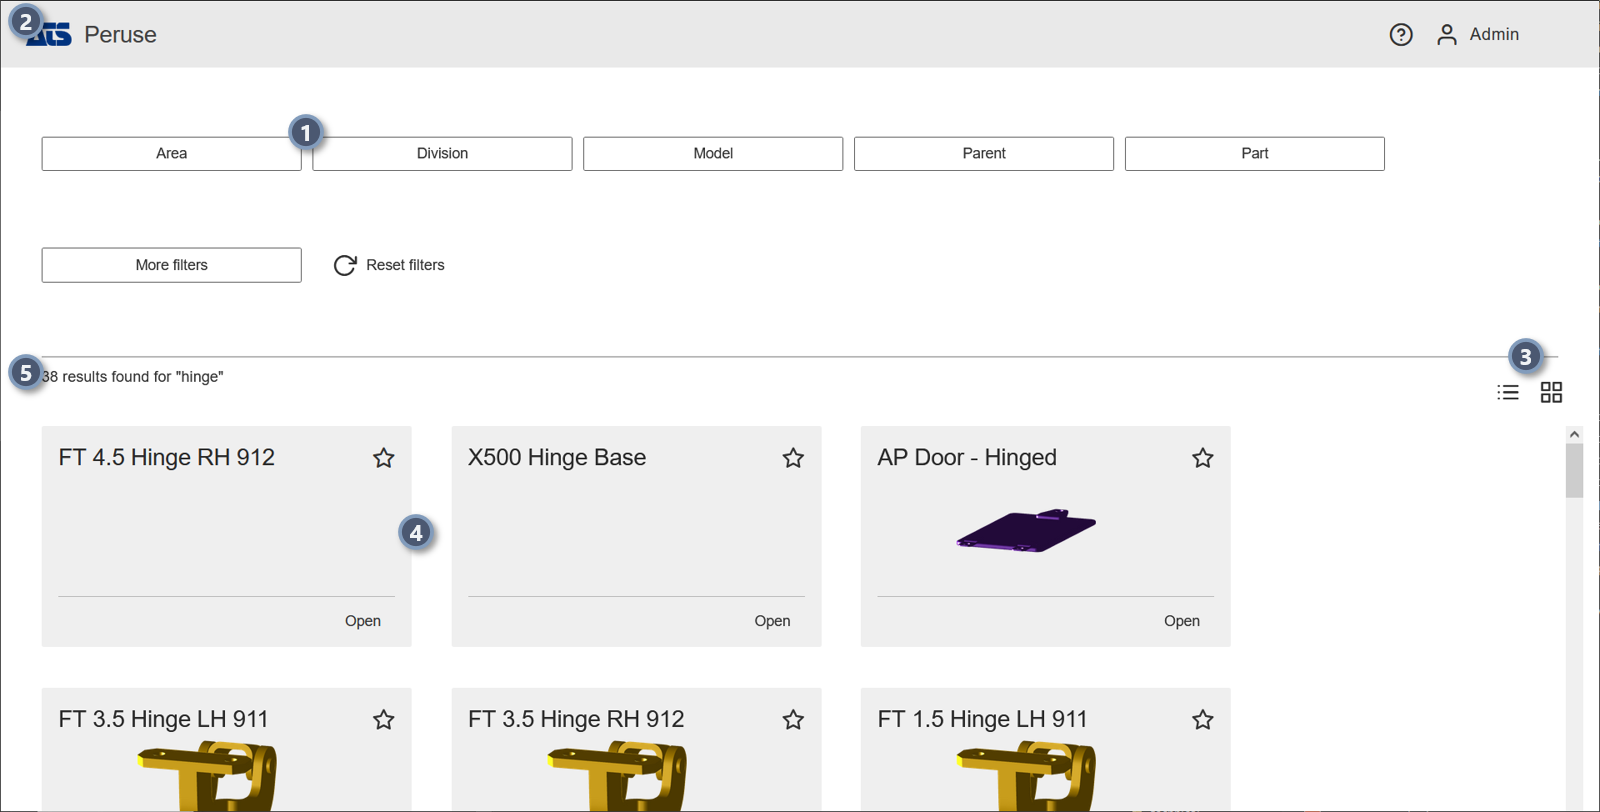
The Search Results page is loaded after a search is executed from the home page. This page shows what was returned from the search and the option selected from the menu - Show All, Routines or Features. Also if you have Routine or Feature filters, these are shown as filter buttons you can use to further refine the search results.
 |
||
|
1. Filters |
The scope of your search can be reduced by selecting options from available filters displayed as buttons along the top of the screen, including DataSources or Routine Filters. Once an initial search is executed, the filters are dynamic based on the search results. This means that if you enter text for the initial search, only filters (buttons and options within the filter popups) which also apply to the data found by the text string are shown on the Search Results page. Any changes to the filter selection triggers an automatic update to the search results. The DataSource filter menu is always available; Routine Filters are only displayed if the accessible data has Routine Filters assigned.
|
|
| 2. Home | Return to the home page to execute a new search or select a Favorite. | |
| 4. Results Display | Search Results can be displayed as either tiles or a grid.
|
|
|
5. Search Results |
This area is where the data results are shown. Each tile (or grid row) is one Routine found with the search string. Click in the top right corner of the tile to add the Routine to your Favorites. | |
| 6. Search Results Summary | The summary text shows the results of the search. This includes the total number of individual data matches found for the search string, and specifies how many of that count are Routines or Features. | |
Peruse 3D Viewer
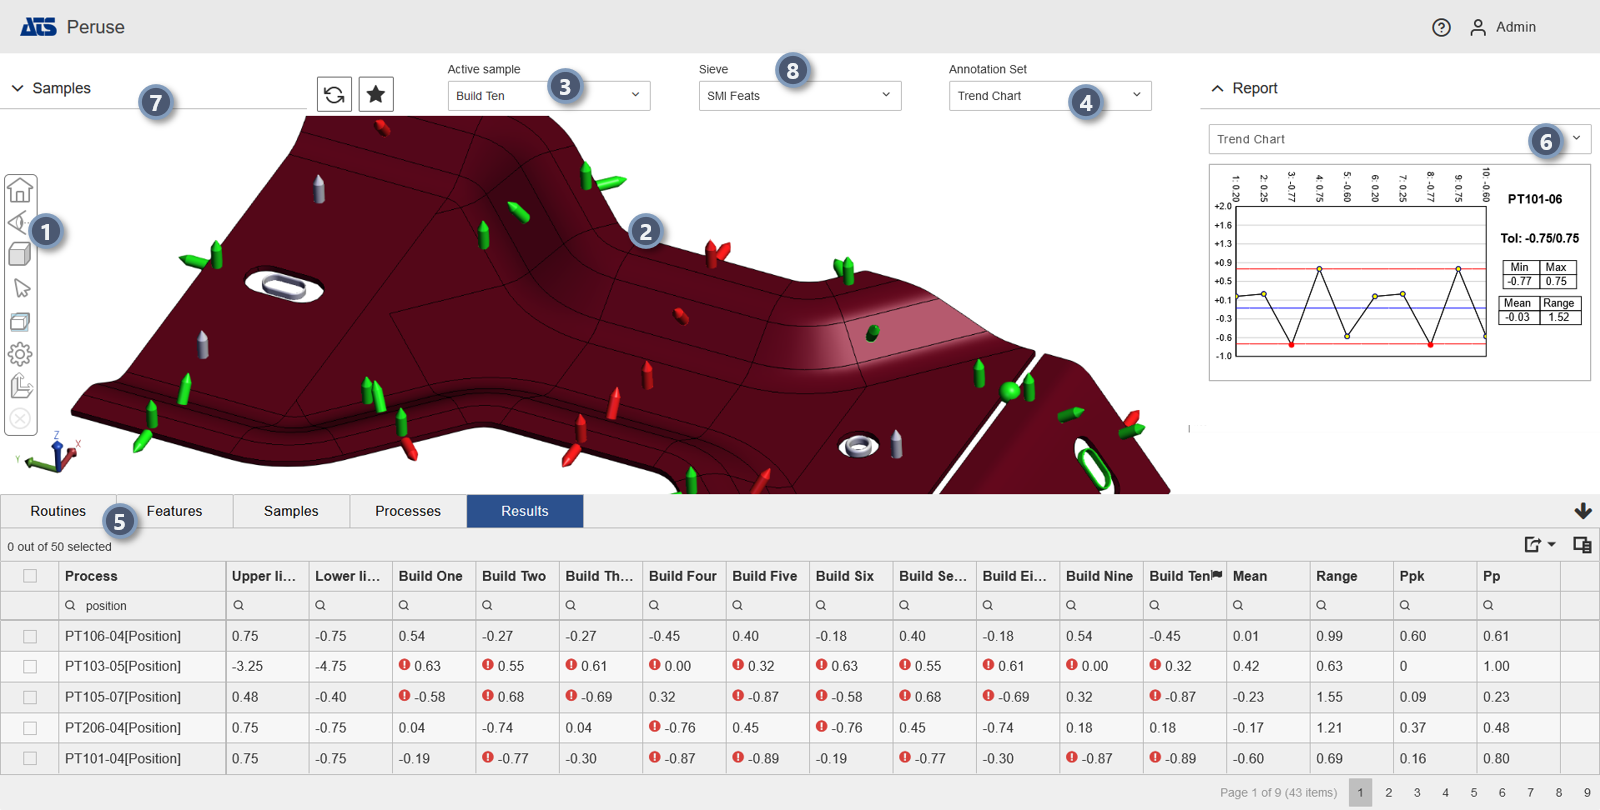
The 3D Viewer page is the area of the user interface containing the 3D model for the loaded data. Once data is selected, whether by clicking a Favorite from the Home page or a result from a Search, the data selected is displayed in the primary page. This page is referred to as the 3D viewer since the main display is the 3D part model. Additional report and grid panels around the outside boundaries of the page can be expanded or collapsed as needed in order to maximize the space for the 3D model.
 |
||
| 1. 3D Tools |
The 3D Viewer Tools are used to manipulate the 3D model in the viewer. The tools are located in a vertical toolbar on the left side of the main view area where the 3D model is displayed. The toolbar becomes semi-transparent when it is not actively in use, and it disappears entirely while the model is loading or the view is inactive while in Layout mode.
|
|
| 2. 3D Viewer |
The primary area of the entire user interface. Once data is selected, whether by clicking a Favorite from the Home page or a result from a Search, the data selected is displayed in the primary page. This page is referred to as the 3D viewer since the main display is the 3D part model. If your data does not have a 3D model available, the feature markers will still appear in the 3D view as long as you have 3D data for the features. Additional report and grid panels around the outside boundaries of the page can be expanded or collapsed as needed in order to maximize the space for the 3D model.
|
|
| 3. Active Sample |
The selected Sample which determines what measurement data is used to populate the Summary Report and color-codes the Feature Markers on the 3D Model. There are additional indicators in the Trend Report and the Grids which also indicate the Active Sample. By default, the most recent Sample is set as the initial Active Sample.
|
|
| 4. Annotation Set |
Predefined styles for the chart annotations that are accessed by right-clicking on a feature marker on the 3D model. Each set has styles designed for each Feature type, so depending on the marker selected you may see a different style of chart annotation. The sets are designed to provide optimal displays of information for the Feature selected.
|
|
| 5. Grid Panel |
The collapsible panel along the bottom of the 3D viewer page that is a shared space for the five data grids: Routines, Features, Samples, Processes and Results. Use the grid headers to navigate between grids. Click on a Grid header to go to the specific grid. The active grid is indicated with different color. If the grid panel is currently collapsed, clicking any of the grid headers will expand the grid panel.
|
|
| 6. Report Panel |
The collapsible panel on the right side of the 3D viewer page where the main reports for your data are located. The dropdown menu contains a list of available reports. Some report types depend on a specific set of data to be selected either from the grid or in the 3D View. The Summary report is displayed by default when data is initially loaded into the viewer page.
|
|
| 7. Sample Panel |
The collapsible panel on the left side of the 3D Viewer page that contains options for loading the actual measurement data for the Routine. This includes several options for choosing which samples are loaded for the current Routine. When collapsed, the Sample panel displays the current sample load method.
|
|
| 8. Sieves | Sieves are predefined filters for selecting the feature types and characteristics to be displayed in the 3D view, grids and reports in CM4D Peruse. Sieve definitions include feature type, characteristics per feature type and characteristic deviation type (absolute or actual values, vector deviation or car deviation). If no sieve is selected, all available processes are loaded. | |
See also:
Can we improve this topic?