Report Panel
The Report Panel is the collapsible area located in the upper right quadrant of the 3D Viewer page where you can see data displayed in various charts or graphs. The Report dropdown menu contains a list of available reports, which are configured by a CM4D administrator (via the CM4D Config plugin). Some reports depend on a specific set of data to be selected either from the grid or in the 3D View.
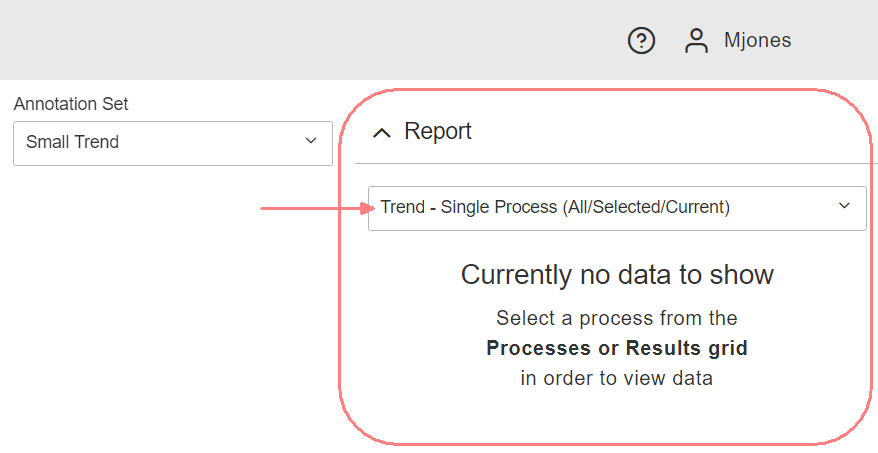 |
The Report panel is expanded and displays the default report when the Viewer page is loaded.
|
Reports always show the most recent Process Baseline. To show a different baseline, change the samples selection to one that uses the desired baseline.
Reports are populated depending on the report configuration. For example, some reports are set to always display data for the last characteristic while others are set to show data for processes/results selected in the grid.
The scope configured determines the dataset displayed in the report.
The following are the categories of data as they relate to reports:
- Characteristics A Characteristic is supporting information for the Feature, a measurable dimension or parameter of a feature such as a nominal X value, or an actual Y value.
- All Characteristics - Display all characteristics for the loaded data.
- Selected Characteristics - Display only the characteristic(s) selected in the data grid.
- First Characteristic - Display only the first characteristic of the loaded data.
- Last Characteristic - Display only the last characteristic of the loaded data.
- Processes A Process is what is being measured, or a single Characteristic of a Feature. Processes include information such as Nominals, Limits and Baselines.
- All Processes - Load all Samples regardless of the Process Baseline.
- Current Process - Load only Samples for the current Process Baseline.
- Samples A Sample is the actual measurement of a Feature Characteristic.
- All Samples - Load all loaded Samples.
- Active Sample - Load only the Active Sample.
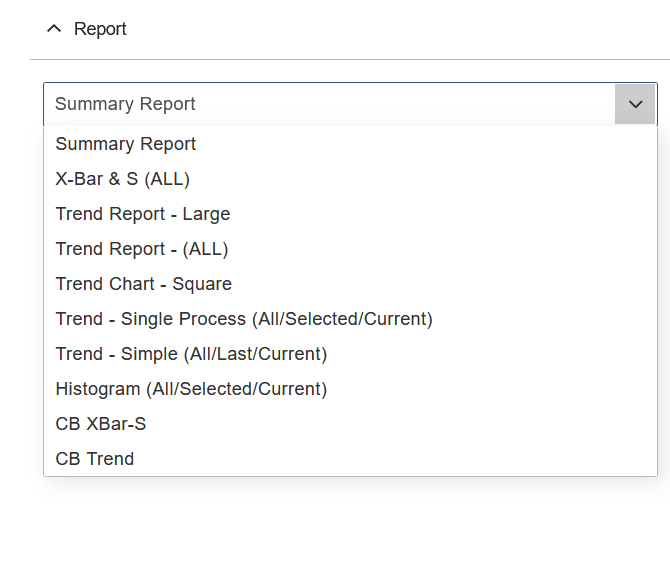
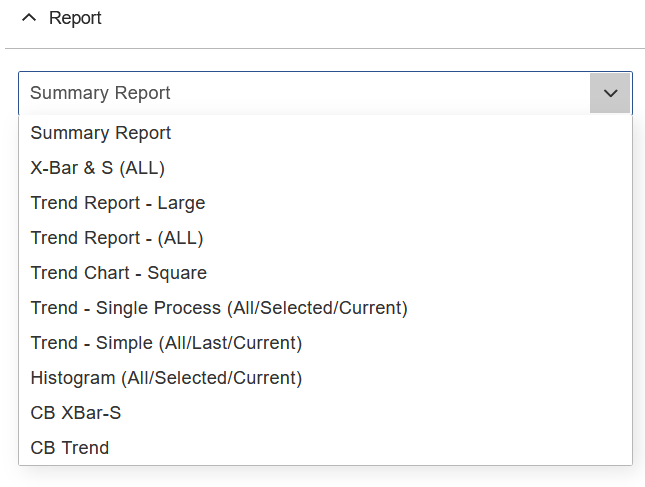
Report dropdown menu example |
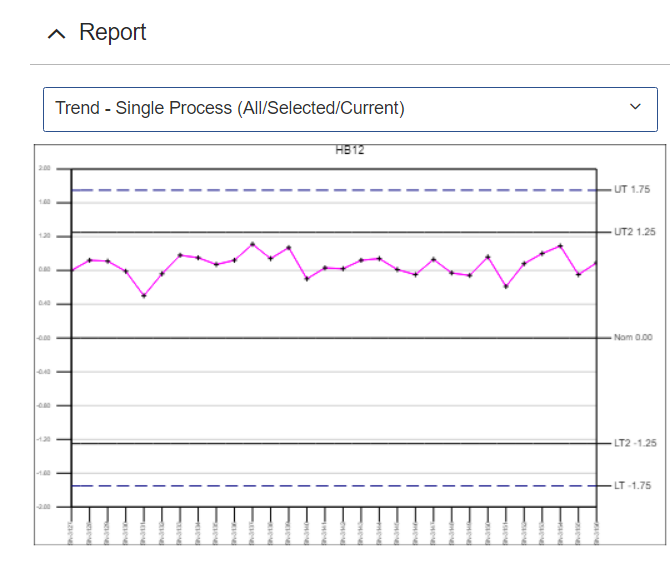
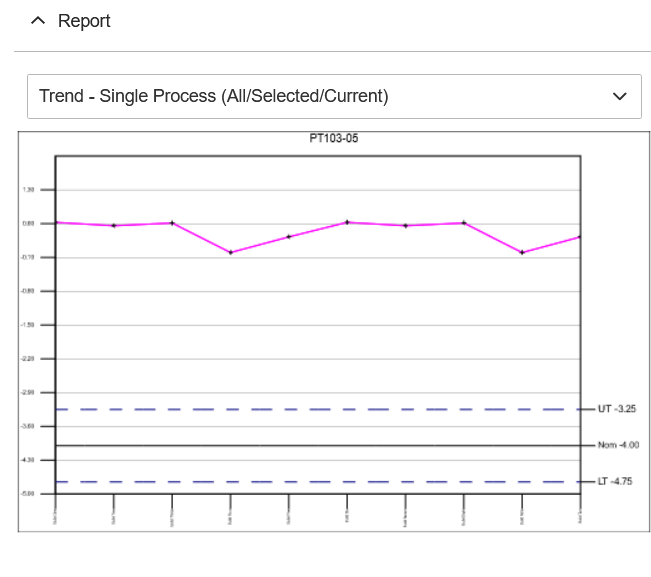
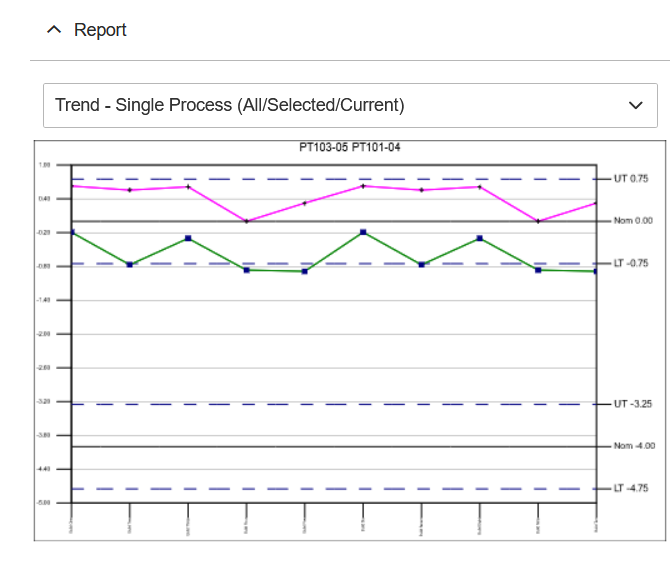
Example Trend report |
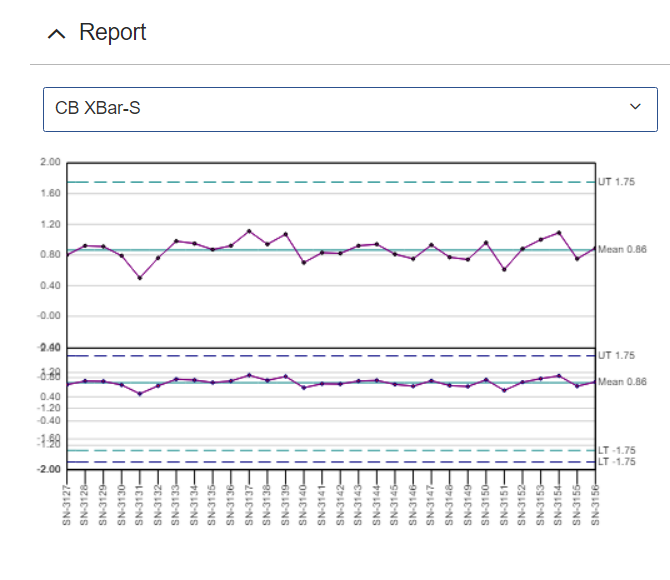
Example XBar-S report |
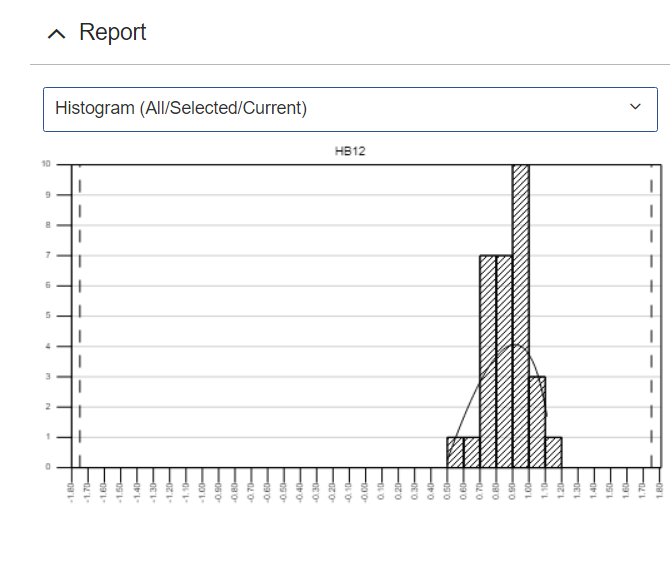
Example Histogram report |
See also, About CM4D Data.
Select a Report
The report set as the default by the CM4D admin is opened when data is initially loaded into the 3D Viewer Page. Depending on the settings for the default report, you may need to select data from the grid in order to populate the report.
To choose a report:
- Open the dropdown menu in the Report panel.
- Click a name from the list of available reports.
- Once you have a report open, select one or more Processes or Results from the grid.
- The report should be populated for the selected data. If it is not, check that the report is intended to show selected data.
- Select another option from the dropdown to view the same selected data in a different report.
Select Data for a Report
Most reports require a selection of data before it can be displayed. This selection is done in one of two places:
Selecting Data from the Grids
The grids display the raw data values for Routines, Features, Samples, Processes and Results. When searching for data, these grids can be used individually or in sequence to find or filter data to show in a report.
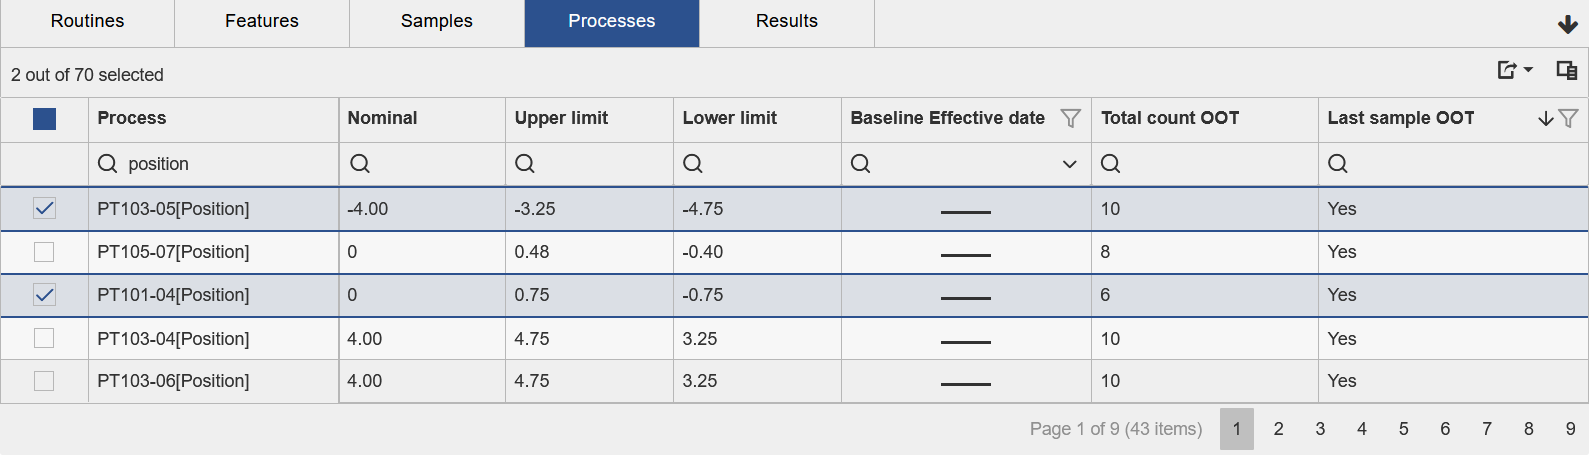
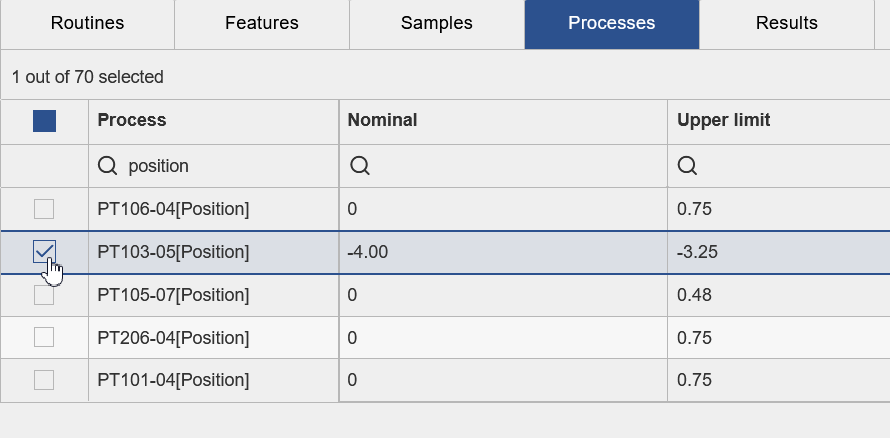
Single Process/Result
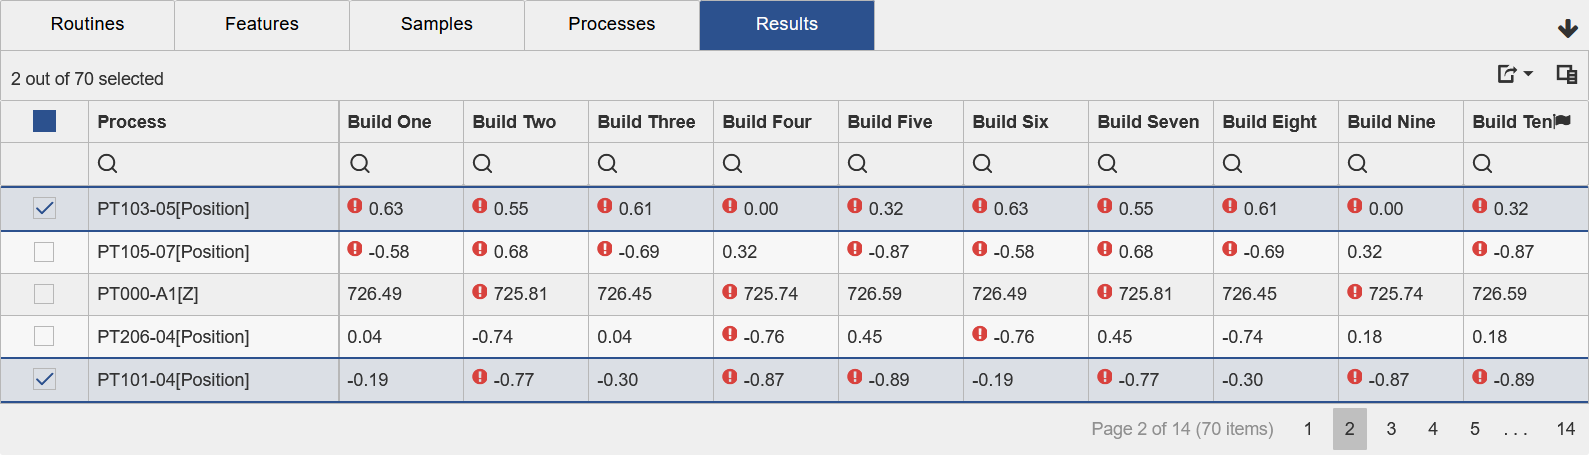
Multiple Processes/Results
See the topic Grid Panel for more information on navigating the data grids.
Selecting Data from the 3D Model
Features are chosen directly from the 3D model by selecting Feature Markers. Features selected on the 3D model are highlighted in other areas of the interface, such as the Grids and Reports.
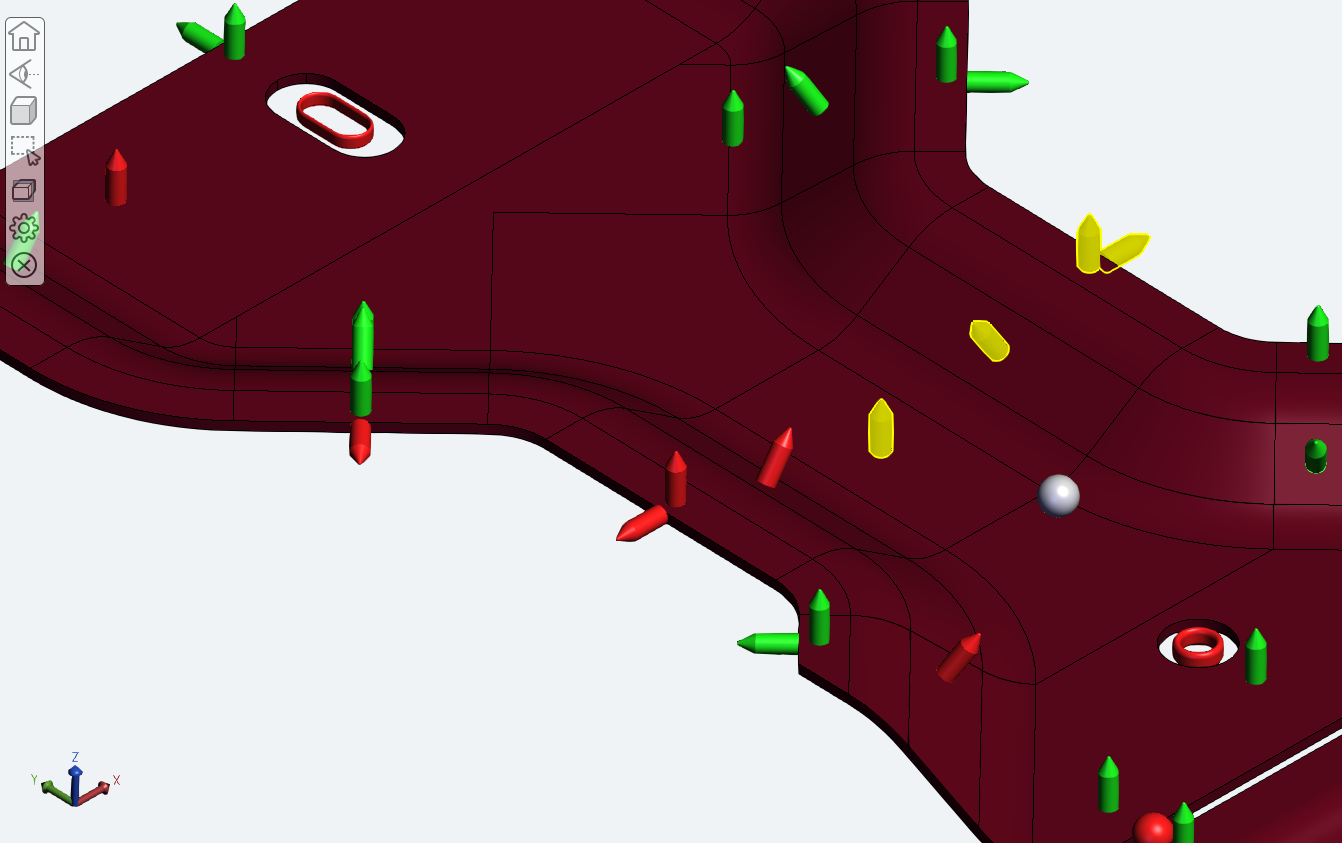
Selected Feature markers are highlighted yellow.
See the topic 3D Viewer Page for more information on selecting data on the 3D model.
Select Multiple Processes/Results
Some reports support the selection of more than one result. In such cases, select at least two processes or results using the methods described above.
|
Single Process/Result |
Multiple Processes/Results |
For information on report configuration, see the topic Peruse Report Configuration.
Can we improve this topic?