Peruse Report Configuration
Reports are the charts or graphs that display information about selected data in the Report Panel of CM4D Peruse.
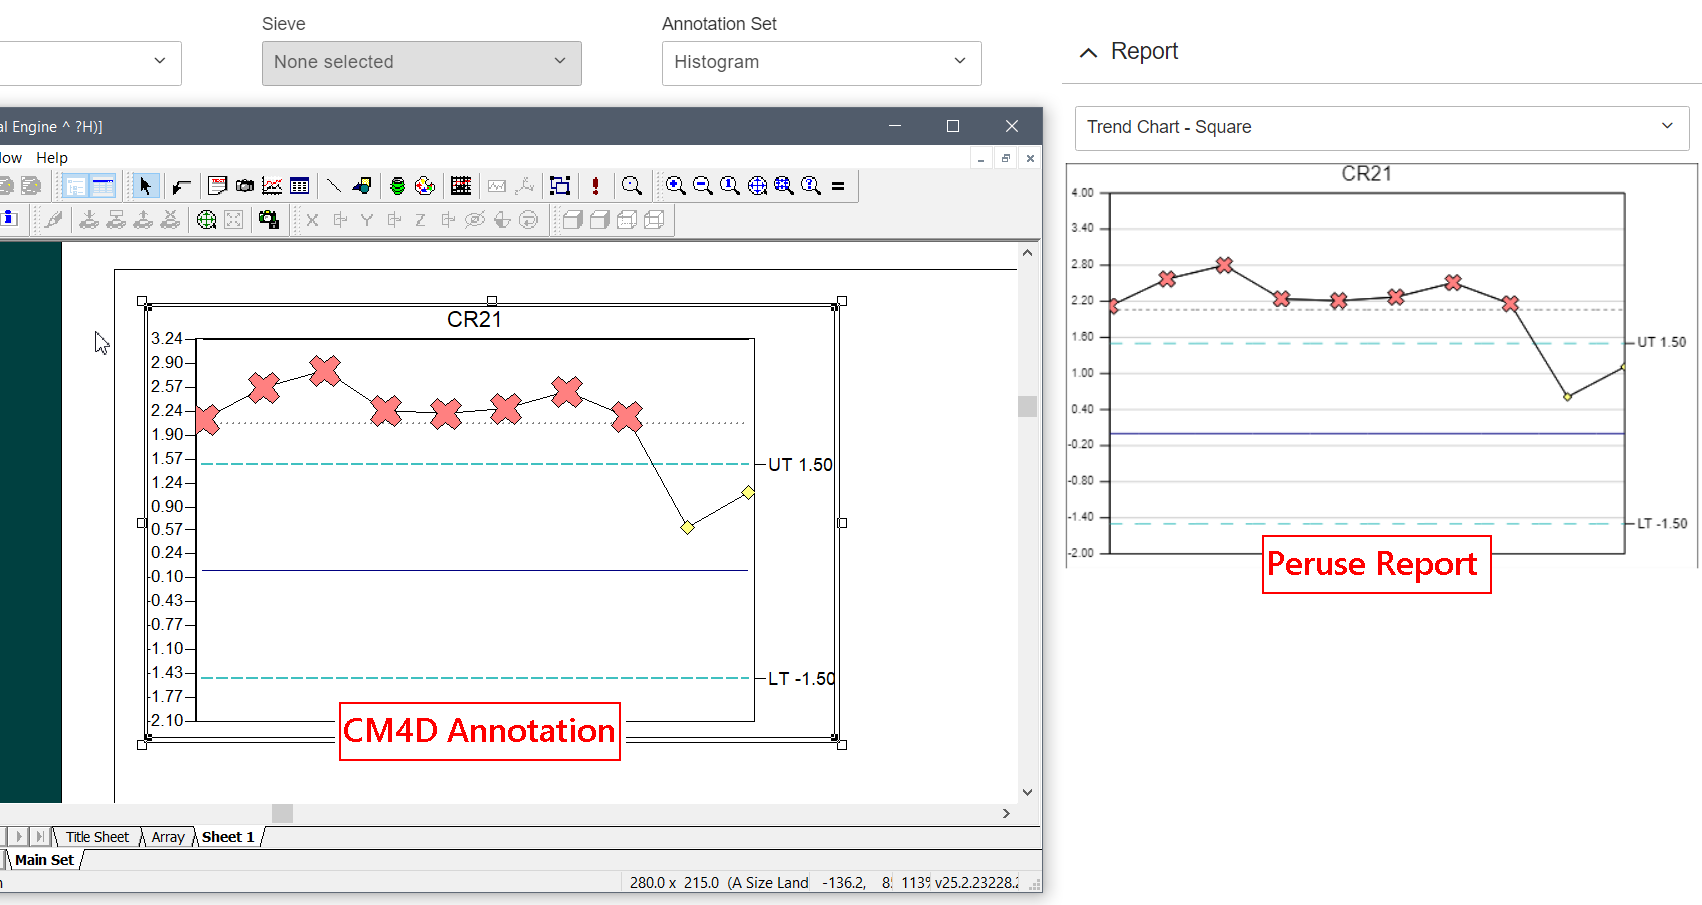
Annotation created in CM4D (Left) are exported and used as Reports in CM4D Peruse (Right).
In most cases, end users like to see overview annotations such as a PIST Benchmark or Top Worst Ppk/Cpk. Other uses may include information about the Active Sample or user-selected processes.
Reports are defined by assigning an Annotation Template and selecting the scope of data that is used to populate the report. The data scope includes a combination of which Samples, Features or Processes are displayed in the annotation. See the section Report Configuration below for details.
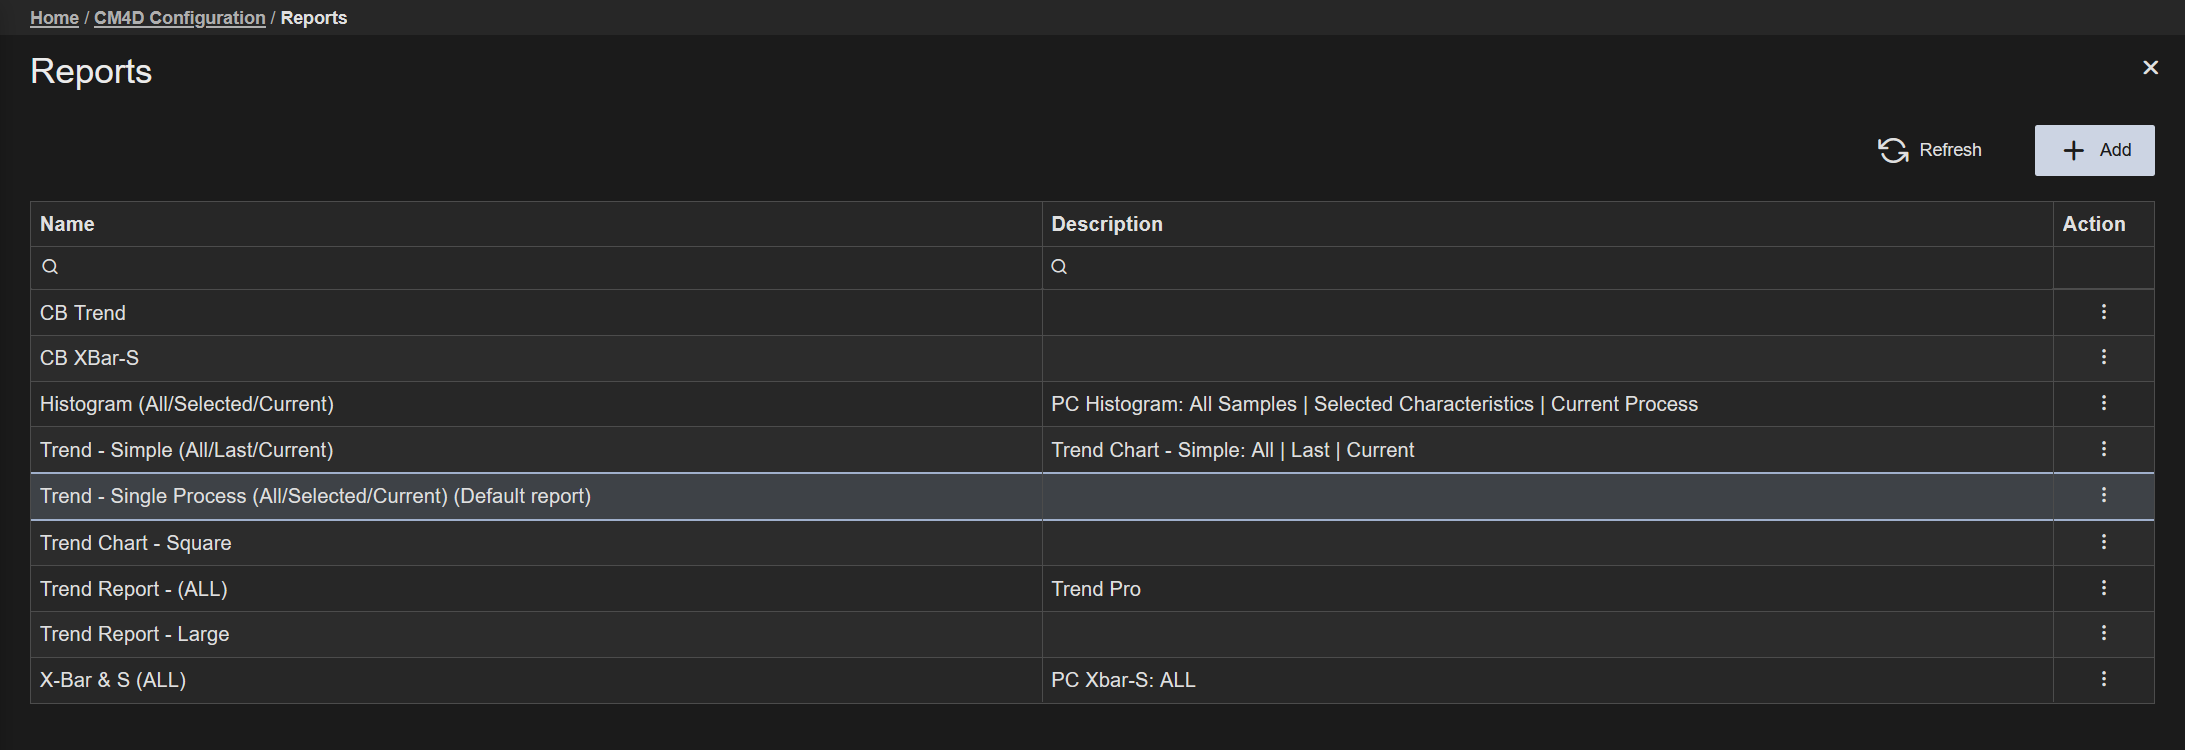
- Add - Create a new Report.
- Refresh - Reloads the grid to show any updates to the current status of the contents.
- Properties - Click on a grid row to modify the properties, or use the Action menu ( Open).
 |
|
| Action | Click the three dots
to open the menu of available actions for the selected row.
|
| Description | An optional description field for the Report. This could be used to provide a brief summary of the report configuration. The description is only used in the Reports grid. |
| Name | The label assigned to the Report. This label appears in the Reports dropdown menu in CM4D Peruse, so it should be identifiable to end users. To help end users choose a report, it is recommended that you include the chart/graph type and indicate the report configuration options (Samples/Characteristics/Processes) as part of the report label. For example, "Trend - Active Sample/Selected Characteristics/Current Process". |
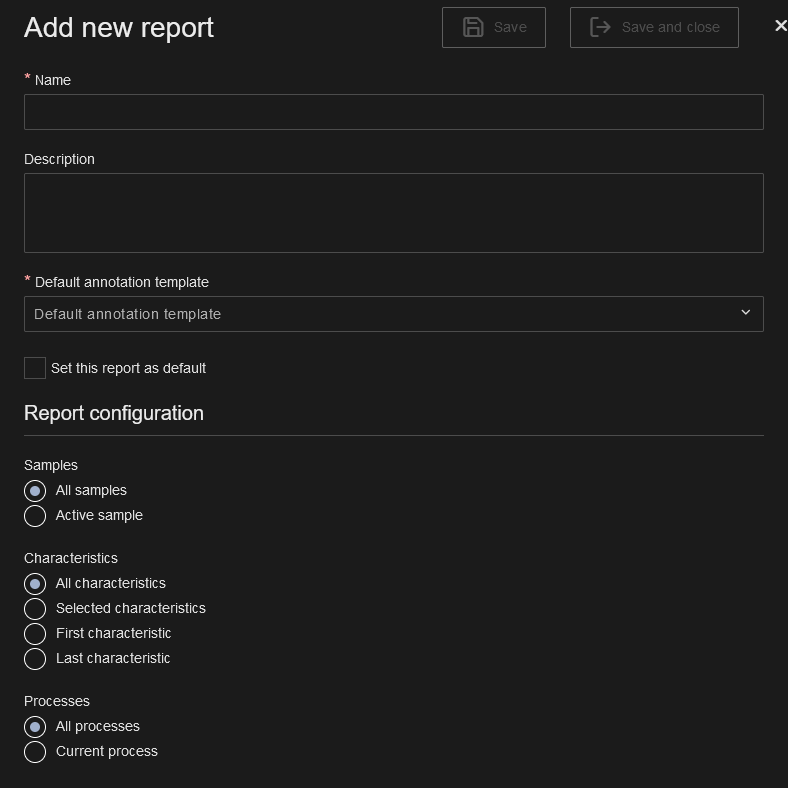
Add New Report
| New Reports are created by clicking Add in the top right of the Reports card. The Add New Report blade is opened automatically. To exit the add new blade without saving, close the blade. To create a new Report:
|
 |
Report Properties
The Report Properties blade contains the options for defining a Report. Each Report is defined by selecting an Annotation Template and choosing the configuration options for the loaded data.
 |
|
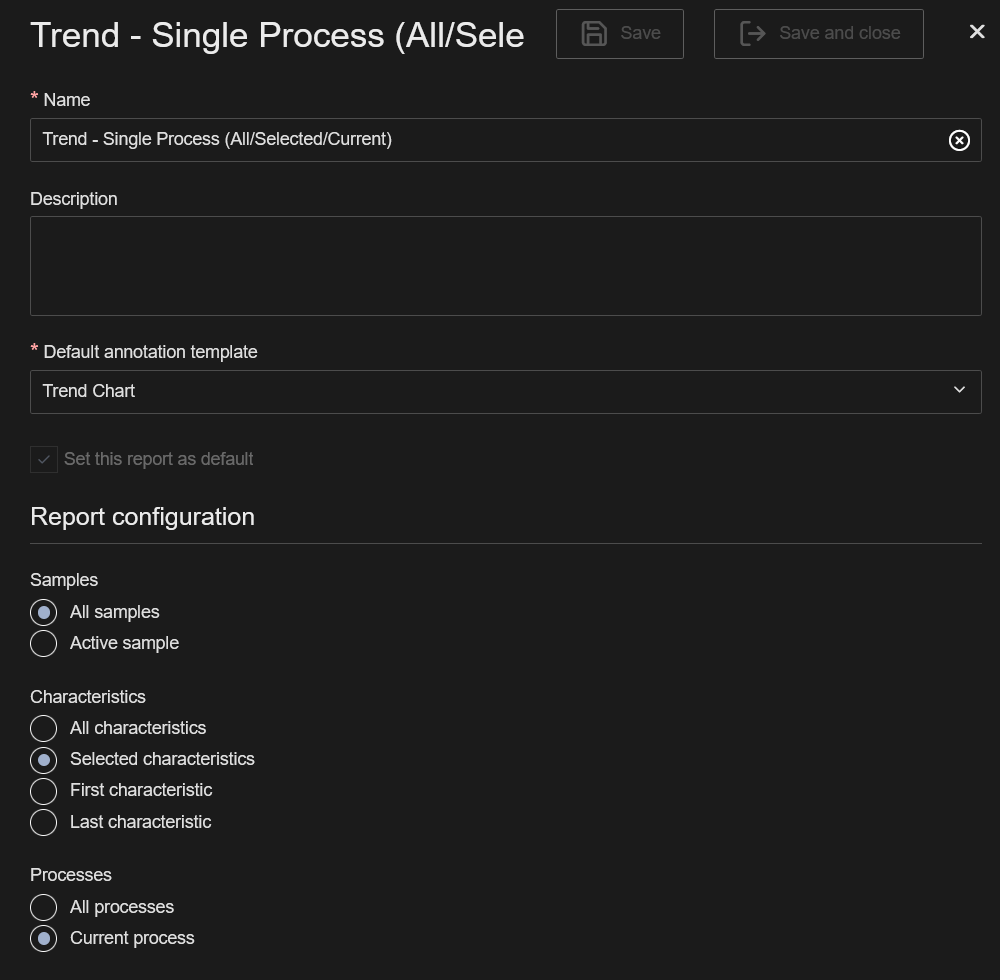
| Annotation Template | Select an annotation template from the dropdown. This is the annotation that appears in the Report Panel area. |
| Description | An optional description field for the Report. This could be used to provide a brief summary of the report configuration. The description is only used in the Reports grid. |
| Name | The label assigned to the Report. This label appears in the Reports dropdown menu in CM4D Peruse, so it should be identifiable to end users. To help end users choose a report, it is recommended that you include the chart/graph type and indicate the report configuration options (Samples/Characteristics/Processes) as part of the report label. For example, "Trend - Active Sample/Selected Characteristics/Current Process". |
| Report Configuration | Depending on the annotation template type and contents, the Report configuration is what determines the data set that is loaded when the report is opened in CM4D Peruse. The following settings determine what data is loaded in the report. Choose one option per category:
|
| Set this report as default | Designate the report as the default for it to be the report that is open when data is initially loaded in the 3D viewer page. |
See also, Peruse Annotation Templates Configuration
Report Configuration
Depending on the annotation template type and contents, the Report configuration is what determines the data set that is loaded when the report is opened in CM4D Peruse.
The scope of the data, equivalent to the DataSource properties of a CM4D DataSet, includes the following options:
| Configuration | Description |
| Characteristics A Characteristic is supporting information for the Feature, a measurable dimension or parameter of a feature such as a nominal X value, or an actual Y value. |
|
| Processes A Process is what is being measured, or a single Characteristic of a Feature. Processes include information such as Nominals, Limits and Baselines. |
|
| Samples A Sample is the actual measurement of a Feature Characteristic. |
|
See also, About CM4D Data.
Reports in CM4D Peruse
In CM4D Peruse, configured Reports appear as a dropdown menu in the Report Panel of the 3D Viewer. The report designated as the default report by the CM4D admin is opened when data is initially loaded into the 3D Viewer Page. Depending on the settings for the default report, the user may need to select data from the grid in order to populate the report.
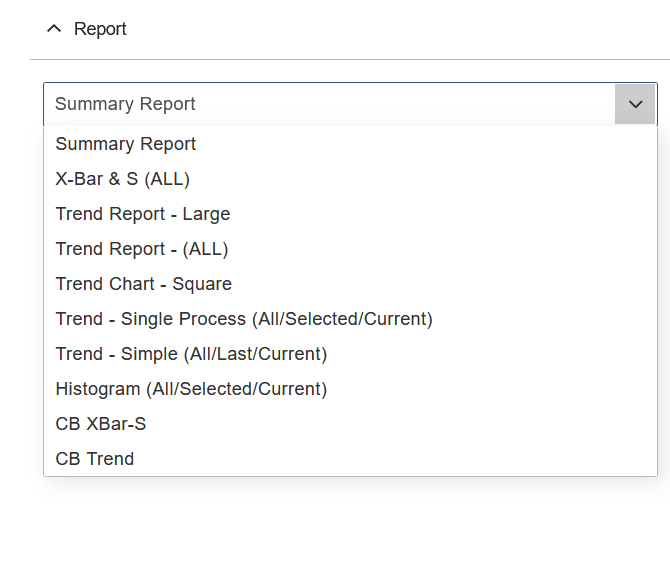
Report dropdown menu example |
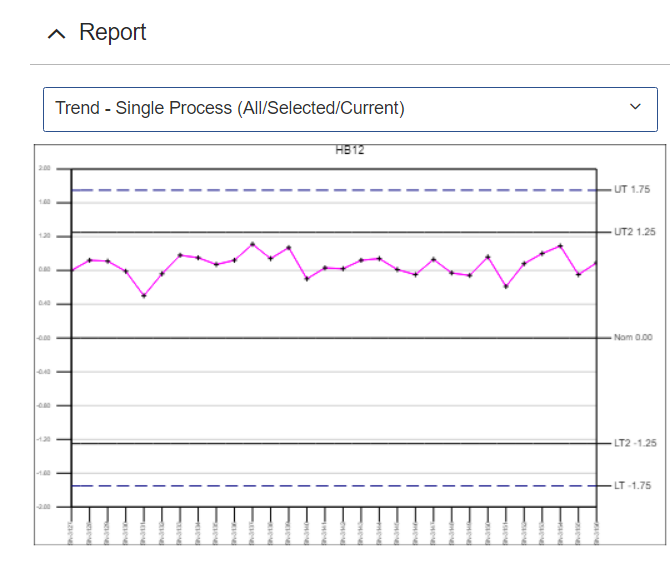
Example Trend report |
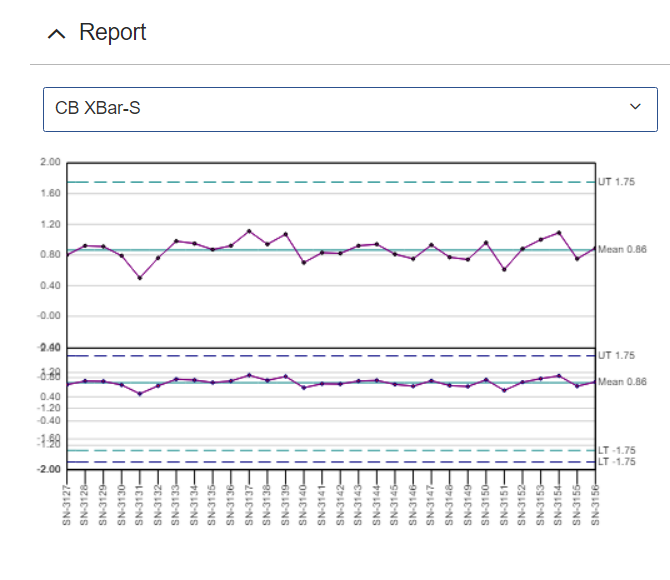
Example XBar-S report |
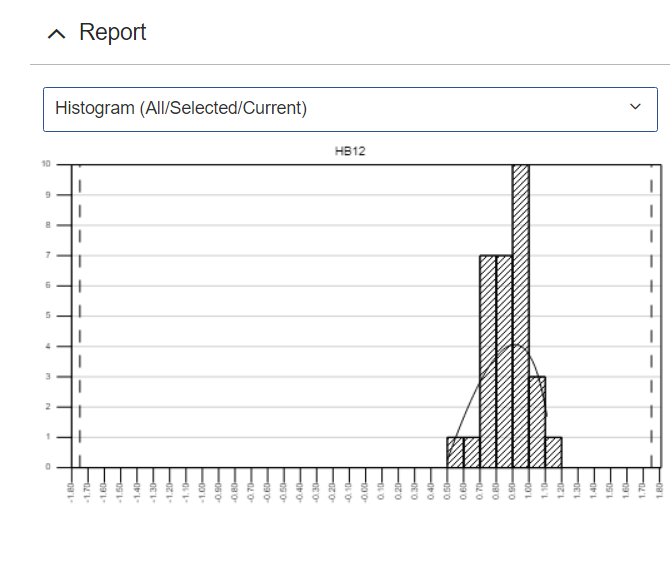
Example Histogram report |
For related end-user information, see the topic Report Panel.
Can we improve this topic?