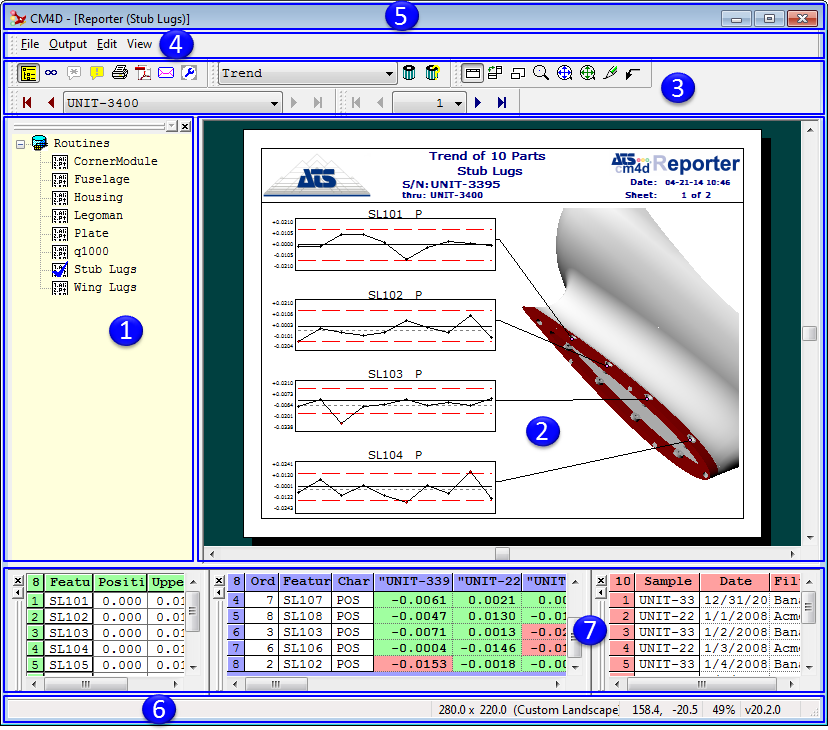
Click on the image below to learn more about the various regions of the user interface.

The Routine Selection Tree contains all routines that are available in the 4Reporter CM4D Reporter database.
The Sheet Display Region is the area where Reports are viewed. If there are multiple sheets in a report, the Sheet Control Toolbar can be used to view them. If you have an image associated with your routine, it will appear on the right-hand side of the sheet.
The Toolbar Buttons allow easy access to the most commonly used menu options, as well as perform functions that are not accessible by any other means. Toolbars (as well as specific buttons) can be enabled or disabled as required using the View menu.
The Menus contain options that are available via toolbar buttons and as well as options that are not available elsewhere.
The Title Bar displays the label of the active Routine.
The Status Bar displays information about selected annotation, toolbar items, and version information.
The Grids display more detailed information about the loaded data (not enabled by default). There are three grids which may be used in CM4D Reporter to view data. Use the View menu to enable or disable the DataSet, Feature, or Sample Grids.
The DataSet Grid displays all of the features and samples within the DataSet in the selected query. There are several functions you can use that sort, remove, and filter the features within the DataSet.
In the DataSet grid, the cells which contain samples will turn a color, depending on the following conditions:
· Red: Data cells identified as "out" by the Event Trigger 1 settings in the DataSet.
· Yellow: Data cells identified as "out" by the Event Trigger 2 settings in the DataSet.
· Green: Data cells identified as "in" by either of the Event Triggers' settings in the DataSet.
· Blue: Data cells identified as "out" by both the Event Trigger 1 and Event Trigger 2 settings in the DataSet.
· White: Data cells contain data with an "undetermined" status. For example, a cell is considered "out" according to the event trigger settings of the DataSet, but there is no tolerance assigned to the particular characteristic. A cell could also turn white if there is either no data, is not active sample, or no event set up in the DataSet.
The Feature Grid displays all of the features within the selected query.
The Sample Grid displays all of the samples within the selected routine.