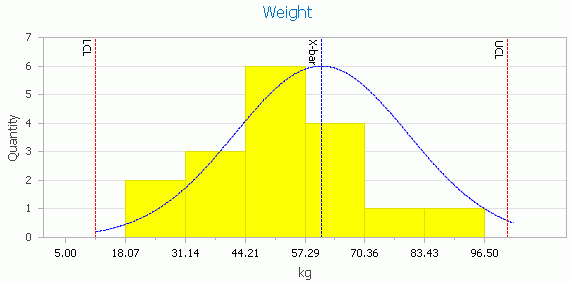
A histogram is used to display the frequency of measurements, the distribution of measurements and how well measurements may or may not be centered around the nominal.
A histogram consists of tabular frequencies, shown as adjacent rectangles, erected over discrete intervals with an area equal to the frequency of the observations in the interval. The height of a rectangle is also equal to the frequency density of the interval, i.e., the frequency divided by the width of the interval. The total area of the histogram is equal to the number of data. In Inspect there are two different types of histogram:
You can switch between using the average value of each subgroup and using every individual recorded value by using the Use Individuals check box below the chart.

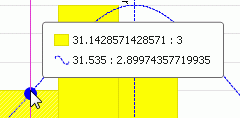
Moving the mouse along the chart will display the exact height of the histogram bar, the quantity of recordings at that value the exact value itself.
