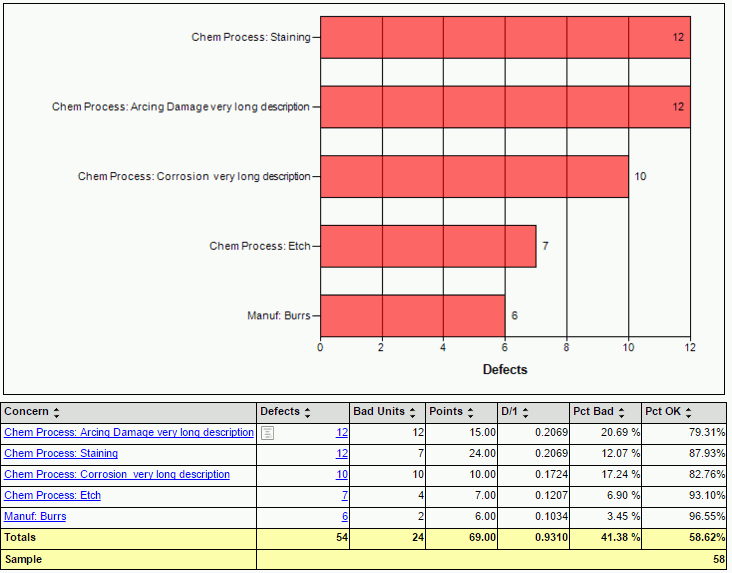
This report displays defects divided by concern.
In the table they are initially ordered by the total number of defects found for each concern. This can be changed by clicking on the heading of the column you wish to order by.
In the chart they are ordered by one of the following parameters that is set using the Chart Result parameter.
● Defects: The total number of defects found for that concern in the sample.
● Bad Units: The number of units in the sample that had the concern.
● Points: The total ranking points of defects with the given concern. A single defect that was very serious could be listed above a defect that occurred several times but wasn't so serious.
● Result: Average number of defects per unit in the sample. This can be changed to D/1, D/100, D/1000 or D/1000000 using the Result parameter. This will also modify the Result column in the table. The calculation includes all units in the sample, including those that didn't have any defects.
● Pct Bad: The percentage of units that had at least one instance of this concern in the sample.
● Pct OK: The percentage of units that didn't have this concern in the sample.
Click on the concern name in the table, or the bar in the chart, to view which parts most frequently have that concern. You can then select a part name to see which locations have the most concerns.
Alternatively, select the number of defects at any of the levels to see a detailed list of all the defects associated to that particular concern, concern/part or concern/part/location. You can then select the ID for an individual unit to view its Single Unit History report (see here).

| Parameter | Description |
Desired Language |
The language the report results will be shown in. |
Pick Date Range |
Either select a date range from the drop-down list or select a Begin Date and End Date using the two parameters below it. |
Begin Date |
The start date for the report. |
End Date |
The end date for the report. |
Shift |
The shifts to be included in the report. |
Defect Area/Group/Station |
The production area, station group or station where the defects were assigned. |
Responsible Area |
The area responsible for the defects occurring. |
Responsible Cell |
The cell responsible for the defects occurring. |
Product/Group |
The product(s) and product group(s) to be included in the report. |
Build Group |
The build group(s) to include in the report. |
Defect Status |
The defect status to include in the report. |
Ranks |
The rank(s) to include in the report. |
Tracking Point/Group |
Selecting the appropriate tracking point or group will provide the sample
size for the report. That is, the number of units that crossed through
that point or group matching with the rest of the filters selected in
the report.
|
Restrict to Units in Sample |
Only count defects that went through the specified tracking point. |
Recording User |
The user that entered the defect. |
Result |
How the results should be shown. For example, D/100 will show the number of defects per 100 units. |
Chart Result |
How should chart results be ranked? By defects, bad units, points, results or percentage ok? |
Min X-Axis Value |
The minimum value for the x-axis. |
Max X-Axis Value |
The maximum value for the x axis. |
Limit To |
Only show the x highest ranked results. |
Show Chart |
Should the chart(s) be shown? |
Show Data |
Should the data table be shown? |
Show Custom Info |
Should custom information be shown? |