ATS Intelligence 3.0 require the following prerequisites:
ATS Licensing Manager (version 3 or better)
ATS Security Manager (version 1.2 or better)
An SSL certificate for the REST, OData and the Security Manager’s ‘Access Rights URL’
Particular ServiceControl (Major version 3.x, do not use version 4.x.).
These prerequisites are provided in an archive named ATS.Intelligence.Particular.zip.
SSL Certificate for the REST, OData and Security Manager’s ‘Access Rights URL’
The ATS Intelligence REST, OData and the ‘Access Rights URL’ endpoints encrypt the data and therefore require a valid X.509 certificate. This certificate must be trusted and must contain a Subject Alternative Name containing DNS entries for the hostname and the fully qualified domain name (FQDN) of the computer that hosts the ATS Intelligence REST, OData and the ‘Access Rights URL’ endpoint. A self-signed certificate can be generated using the following PowerShell script and is valid for 3 years:
New-SelfSignedCertificate -DnsName <FQDN>, <Hostname> -CertStoreLocation "cert:\LocalMachine\My" -NotAfter (Get-Date).AddYears(3)

The PowerShell CMD screenshot above shows the thumbprint after generating the certificate. The thumbprint is used to register the certificate with the port to which the endpoint will be bound.
The certificate is stored in the Personal location of the Local Machine certificate store. The certificate should be copied to the Trusted Root Certification Authorities to complete the trust chain.
After the certificate is generated, PowerShell or another tool could be used to generate a GUID that serves as an Application ID which is also required to register the certificate with the port numbers that the endpoints are binding to. The following instructions should be executed from the command line as an Administrator to register the certificate.
netsh http add sslcert ipport=0.0.0.0:9504 appid={<GUID>} certhash=<Certificate thumbprint>
netsh http add sslcert ipport=0.0.0.0:9506 appid={<GUID>} certhash=<Certificate thumbprint>
netsh http add sslcert ipport=0.0.0.0:9508 appid={<GUID>} certhash=<Certificate thumbprint>
The endpoints bind to baseport + 4, 6 and 8 where baseport is configured during the installation.
Installing ServiceControl
Start the ServiceControl setup utility that is present in the Particular.Service.Platform.zip file.
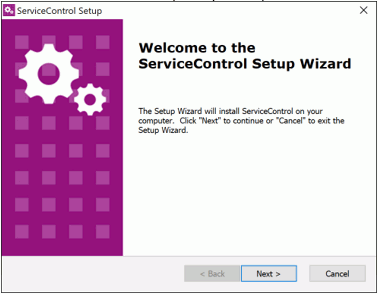
Press Next.
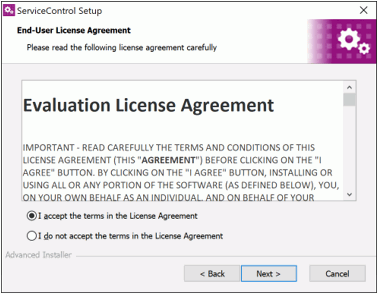
Accept the EULA and press Next.
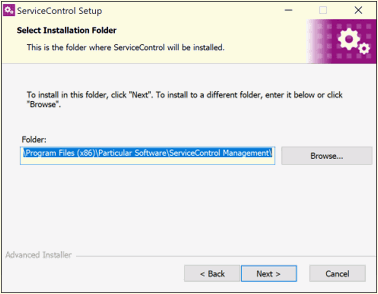
Select the installation directory and press Next.
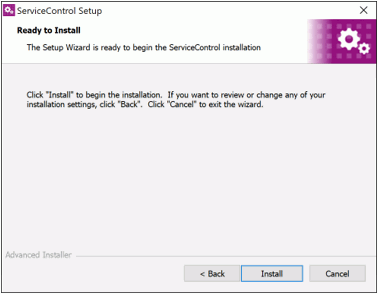
Press Install to start the service control installation.
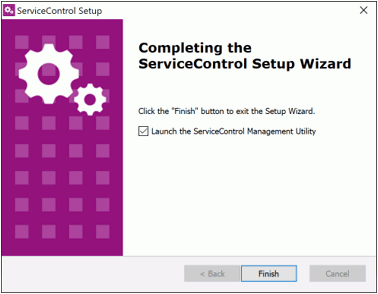
Select the Launch the ServiceControl Management Utility check box and press Finish.
Configuring ServiceControl
The ServiceControl management tool is started when ticking the Launch the ServiceControl Management Utility check box at the final step in the ServiceControl installer. This tool can also be started from the Windows start menu. This tool configures ServiceControl and Monitoring instances.
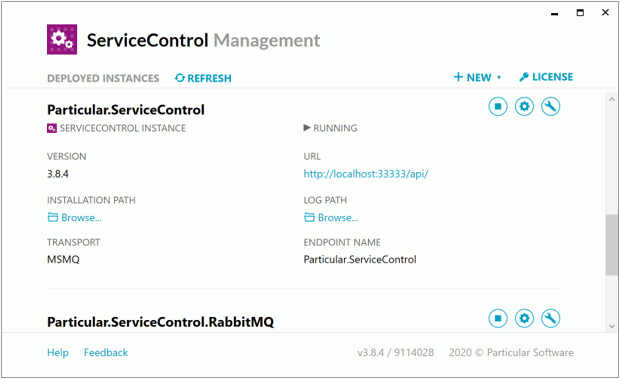
Select the +New button at the top right-hand side to add a new ServiceControl or monitoring instance.
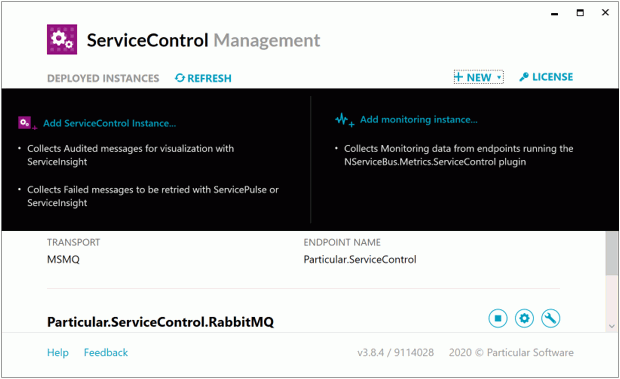
Select Add ServiceControl Instance to add a new ServiceControl instance. This instance should be configured with the following properties:
The name of the ServiceControl windows service. This name is also used as the name of the control queue for this instance. The control queue is used to exchange heartbeats, custom check info and saga state changes.
The user that should run the ServiceControl service.
A hostname (localhost).
A free port number for the ServiceControl HTTP interface (http://localhost:33333/api) used by ServiceInsight and ServicePulse.
A free port number for the ServiceControl embedded database maintenance interface. This will create an endpoint (http://localhost:33334) that can be used to access RavenDB Studio to maintain the ServiceControl embedded database.
The paths for the database and log files. The management tool creates default directories on the C drive.
Please be advised that the ServiceControl database may consume a lot of disk space depending on the retention times configured for this instance. The average message size and the amount of messages processed. Moving the database to a drive that has more storage space is advisable.
Error retention: 5 days. This gives the user 5 days to detect errors and retry the messages using ServicePulse or ServiceInsight. The value could be set to a higher value but that requires more disk space to be used by the embedded ServiceControl database. The approximate storage capacity required depends on the amount of messages being audited * their message size * the retention time.
Audit retention: 2 days. The value could be set to a higher value but that requires more disk space to be used by the embedded ServiceControl database. The approximate storage capacity required depends on the amount of messages being audited * their message size * the retention time.
Transport should be set to MSMQ.
A name for the error and audit queue.
Error and audit forwarding should be set to ‘Off’
The ServiceControl management application will start the ServiceControl instance once it is configured and it will create the control, audit and error queue when they are not present.
Select Add Monitoring Instance to add a new Monitoring instance (ATS Intelligence 3.0 only). This instance should be configured with the following properties:
The name of the Monitoring windows service. This name is required later when configuring ATS Intelligence.
The user that should run the ServiceControl service.
A hostname (localhost).
A free port number for the Monitoring HTTP interface (used by ServicePulse).
The paths to the log files.
Transport should be set to MSMQ.
The name of the error queue.
The ServiceControl management application will start the Monitoring instance once it is configured and it will create the monitoring queue when it is not present.
Installing ServiceInsight
Execute the installer named serviceinsight-<version>.exe.
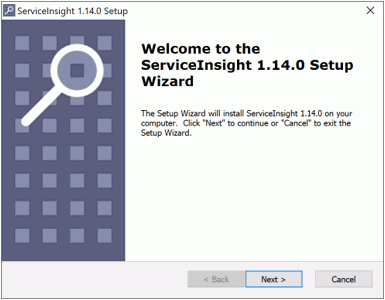
Press Next.
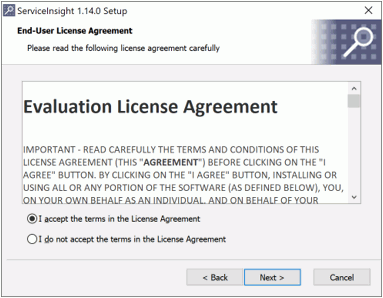
Accept the EULA and press Next.
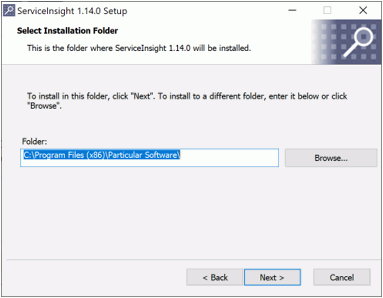
Select an installation directory and press Next.
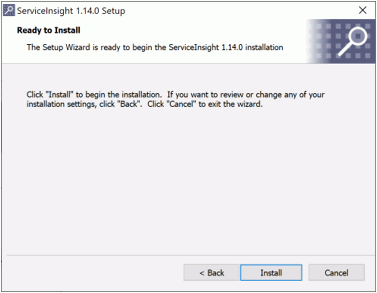
Press Install.
ServiceInsight is available via the Windows Start menu.
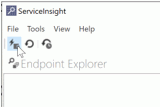
Press the lightning bolt to provide the ServiceControl endpoint.
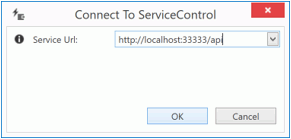
The default URL is http://localhost:33333/api.
Press OK to accept the provided endpoint.
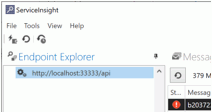
The endpoint is shown on the left-hand side in the Endpoint Explorer. Pressing the pin will not collapse the view.
Installing ServicePulse
Execute the installer named Particular.ServicePulse-<version>.exe.
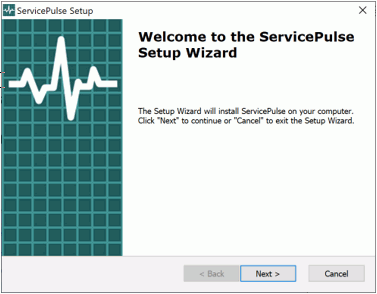
Press Next.
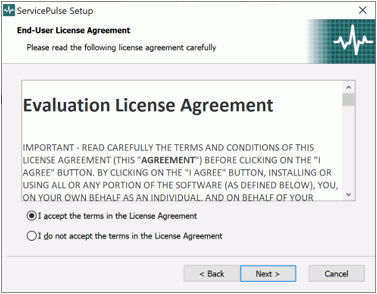
Accept the EULA and press Next.
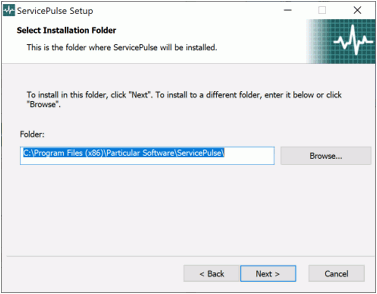
Select an installation directory and press Next.
Provide the following information and press Next:
Port: The port number at which the ServicePulse web interface is accessible.
ServiceControl URI: The endpoint of the ServiceControl instance. The default value is http://localhost:33333/api.
Monitoring URI: The endpoint of the monitoring instance. The URI is configured via the ServiceControl Management application.
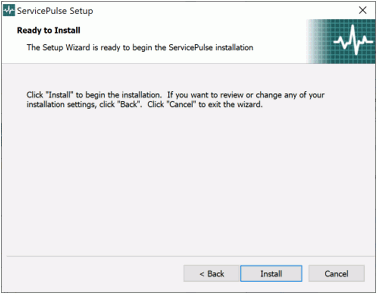
Press Install.
ServicePulse is accessible via any web browser by typing in the following address: http://localhost:9090