The View tab of the View Annot Properties dialog allows you to modify the various properties of a View annotation.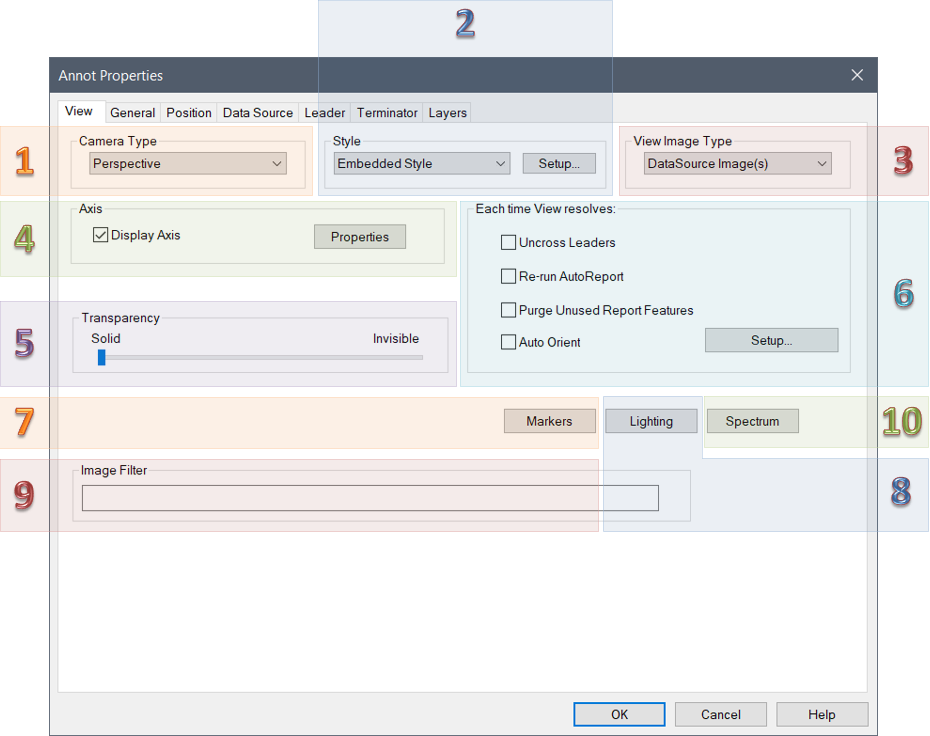
1. Camera Type
There are two Camera Types which can be used for a View annotation in CM4D:
- Perspective - Views with a Perspective camera type are those which will display 3D images and depth relationships on the two-dimensional surface of a View. In other words, images will appear to have vanishing points and depth within a View, representing a "natural" view of a 3D image. Perspective is the default camera type for all view.
- Orthographic - An Orthographic view is on having perpendicular lines and no converging points. This type of view may be preferred for technical purposes, such as use with displaying Alignment reports.
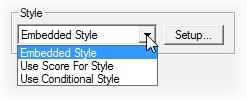
2. Style
Within Style, you can choose a Style type to apply to the View. Style options include: Embedded Style (default), Use Score for Style, and Use Conditional Style.
3. View Image Type
There are four View Image Type options:
- No Image - No image/model is loaded. If feature markers are available for the data, those are displayed in the view.
- DataSource Image(s) - Displays an image that is saved in the database and associated to the View's DataSource. See the topic Models and Images in CM4D.
- Document Image(s) - Displays an image that is saved in the document. See the topic Images Tab.
- Display View Axis - Displays the View axis triad, without any 3D model. See the topic Display Axis.
4. Axis
The View Axis represents the coordinate planes of a 3D image within the view. The Axis will follow the orientation of the image as it is rotated.
This property does not apply to the View Type Display Axis.
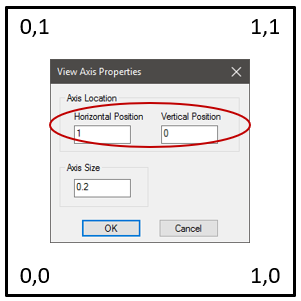
View Axis Properties
The View Axis Properties dialog contains options to adjust the size and position of the XYZ axis as it appears in a View annotation.
- Axis Location - The coordinate position within the area of the View annotation. Enter a value between zero (0.0) and one (1.0) in the Horizontal and Vertical position fields to assign the coordinate position of the axis triad in the View. One of the four corners using 0 and 1 are typically used (as shown below), but intermediate decimal coordinates are valid. The axis position also determines the corresponding location of the orientation cube.
| Axis Location | Horiz. | Vert. | |
 |
Bottom Left |
0.0 |
0.0 |
|
Bottom Right |
1.0 |
0.0 |
|
|
Top Left |
0.0 |
1.0 |
|
|
Top Right |
1.0 |
1.0 |
|
|
Horizontal Left |
0.0 |
|
|
|
Horizontal Right |
1.0 |
||
|
Vertical Top |
|
1.0 |
|
|
Vertical Bottom |
0.0 |
||
Orientation Cube Location - The cube is automatically positioned diagonally opposite to the axis triad. For example, if the axis position is (1,0) then the position of the cube is (0,1).
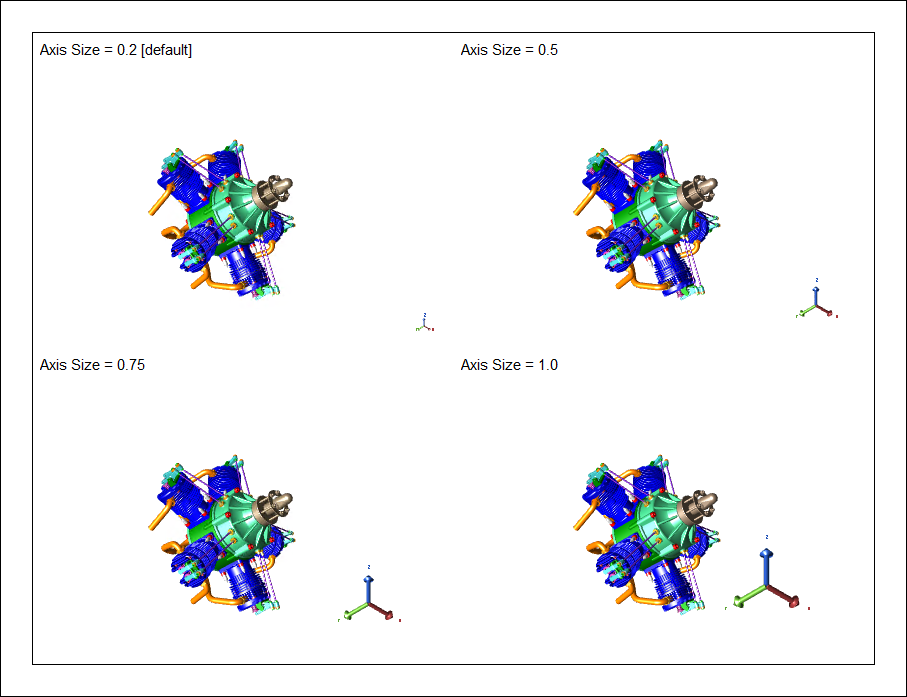
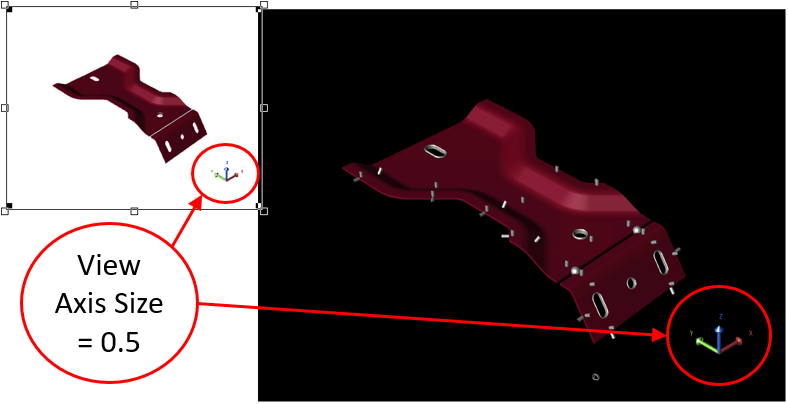
- Axis Size - The size of the axis tripod. Enter a number in the Size field; this value represents a decimal percentage in relation to the view area. The default is 0.2. This size also automatically applies to the Orientation Cube, which is visible only when the view is in Edit Mode.
5. Transparency
View Transparency refers to the opacity of the image within a view annot. To alter the degree of transparency, slide the bar between Solid and Invisible. Moving the slider bar towards Invisible will make any markers on the opposite sides and interior of the view visible.
![]()
The transparency slider in the View properties only applies to Views that use the Display Mode Shaded or Shaded with Lines.
If you are using a 3D image file that has transparency settings defined in the image file, then the predefined transparency settings will be imported along with the image into CM4D. If you set Transparency on the View, the View transparency settings will override any transparency settings embedded in the file.
For JT images with built-in transparency, adjusting the transparency slider in the View properties may have unexpected results.
6. Each time View resolves
Select any of the following options you want to apply each time a View is resolved.
Uncross Leaders
When the Uncross Leaders check box is enabled, any leader lines attached to your view will be automatically uncrossed each time the View is resolved. The Uncross Leaders function will only work properly if the View is connected to the same DataSource as the Annot with which it is connect
Re-run AutoReport
The Re-run AutoReport check box enables the continuous Auto Report function. This option allows the Auto Report to be run on an individual View, so that each time the View is resolved, the existing Auto Report is refreshed. If this check box is enabled, and Undo AutoReport Layout is selected from the Sheets Menu, the following warning dialog will appear:
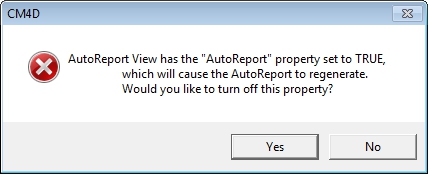
Clicking Yes in the warning dialog will disable the Re-run AutoReport check box in the View Properties and remove Auto Report from the View. The Re-run AutoReport function differs from the Sheet Auto Report in that at the Sheet level, Auto Report must be Run from the Auto Report dialog each time DataSet information is modified. Using the View Properties Re-run AutoReport allows the Report to automatically resolve any changes made to the DataSet information in the Report each time the view is resolved.
Purge Unused Report Features
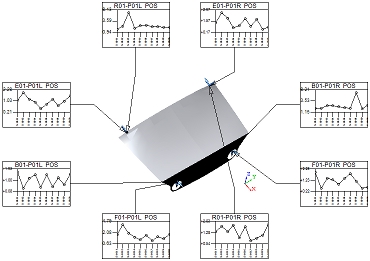
The Purge Unused Report Features check box determines whether or not feature markers will be displayed in the View. Any features included in the View that do not have associated annot on the sheet will not have feature markers displayed in the View when the Purge option is enabled.
| Purge Enabled | View with Purge Disabled | |
 |
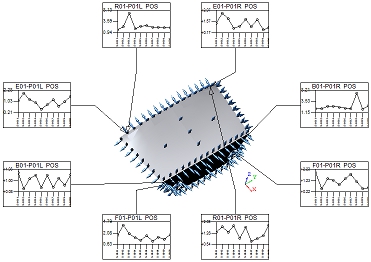 |
The Purge option is particularly useful when running AutoReport or ReportTweak, since only the features relating to the particular annot on a sheet will be shown in a View.
Auto Orient
You can set up a View to orient the 3D image according to specific rules. To use the Auto-Orient functions, enable the check box and click Setup to configure the orientation options.
For more information, see the topic Auto Orient a View.
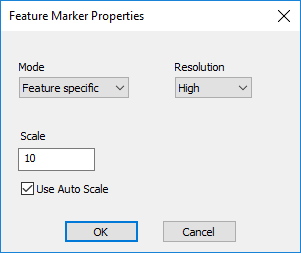
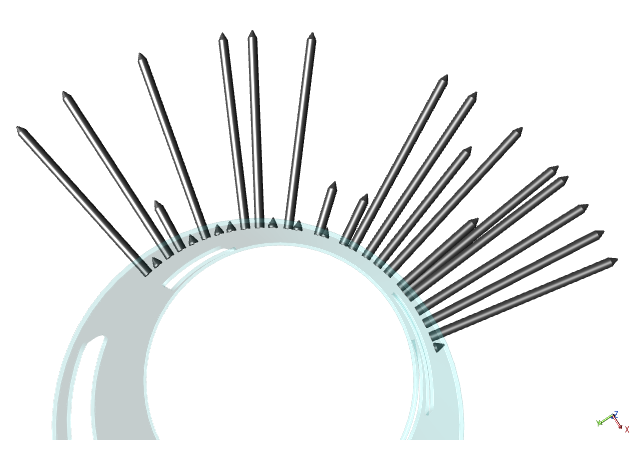
7. Markers
The marker settings apply to the Feature Markers in the View.
 |
|
| Mode | Set the type of Feature markers; applies to all features in the View.
|
| Resolution | Set the display resolution of the feature markers in the View. This setting may affect performance of loading Views depending on your hardware or network capabilities.
|
| Scale | Resize the feature markers by entering a value multiplier. Scale is based on the entire model image, so if you find the markers too small perform a zoom max on the view to check if there are any extraneous parts to the model which may be apart from the primary model coordinates.
The feature marker settings are also available via the CM4D API. See here for details. |
The feature marker settings are also available via the CM4D API. See here for details.
8. Lighting
Apply custom lighting to the 3D models in the View.
See the topic View Lighting for more information.
9. Image Filters
Image Layers may be assigned to individual DataSource images so that multiple images may be assigned to a single routine while still allowing views to use individual images.
See the topic Image Layers for more information.
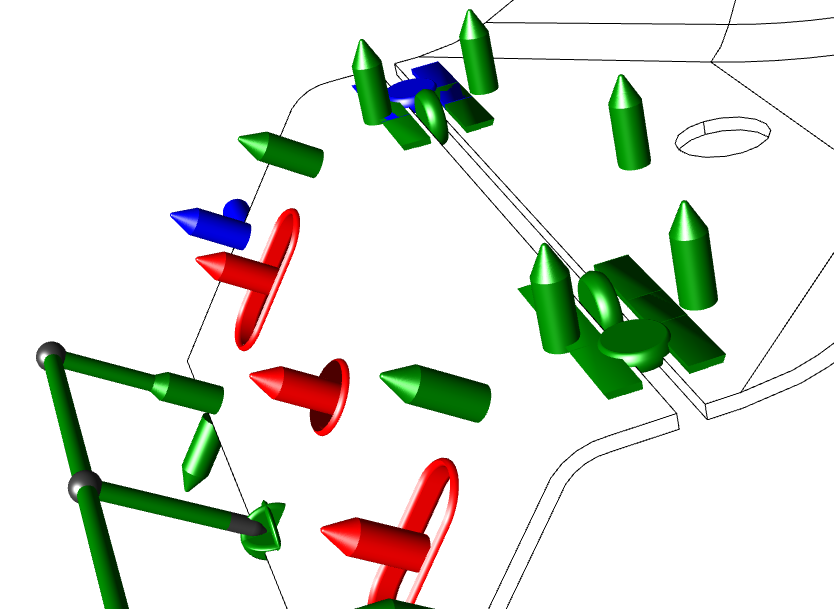
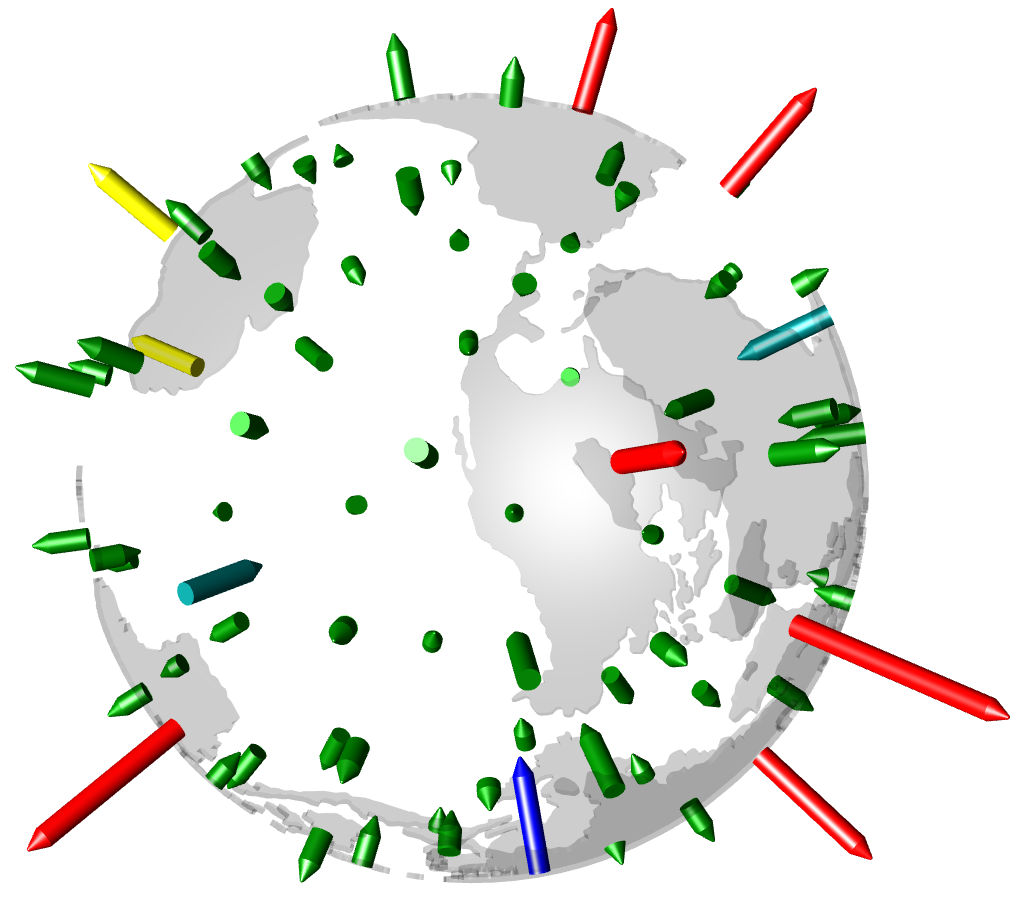
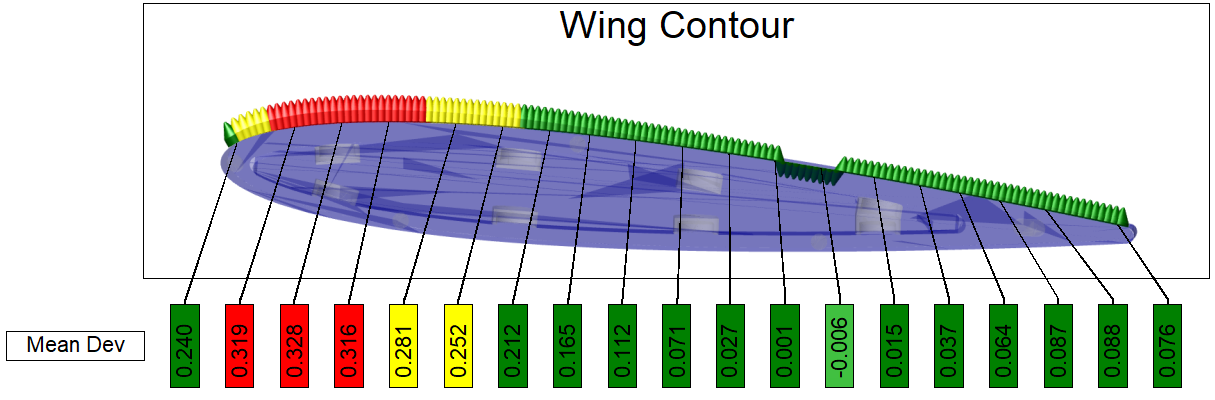
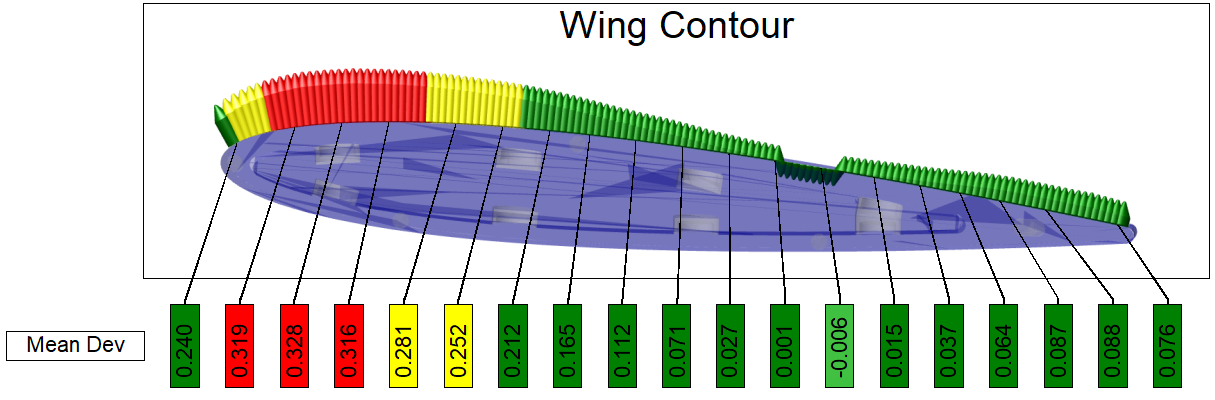
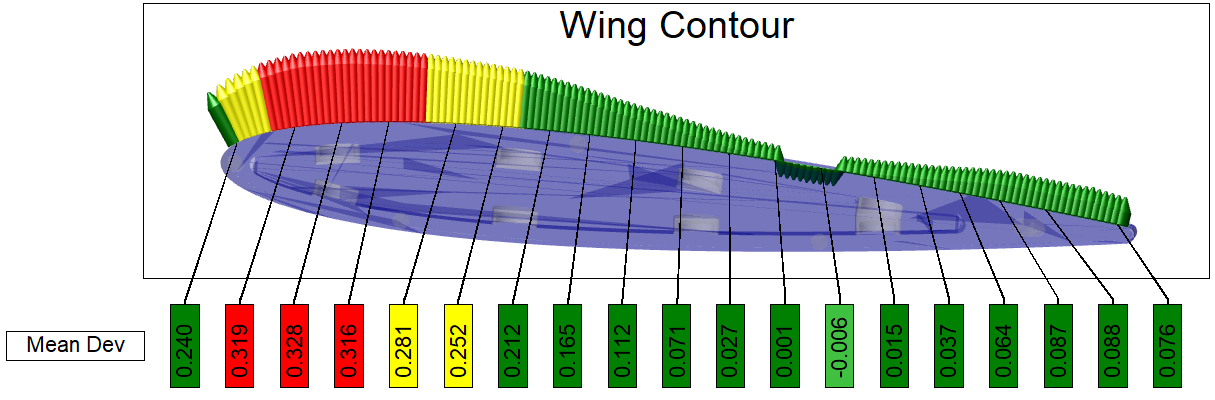
10. Spectrum
The Spectrum functionality allows you to visualize actual data by changing feature markers to indicate data states. Spectrum evaluates the data in the DataSet assigned as the Views' DataSource. The evaluation is performed using a variable or expression, the results of which are then sorted into nodes (i.e., bins) according to the properties of the Nodes. Each Node has its own variable or expression that is used by Spectrum to find the qualifying data and to assign a Style to the marker to indicate the end result.
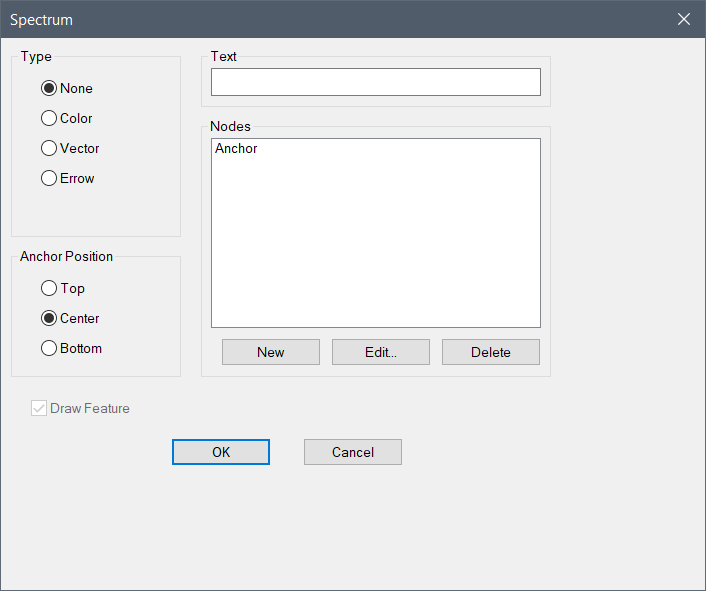
Spectrum Properties
Select the Type, assign a variable and/or expression in the text field and create Nodes to sort the data.
 |
|
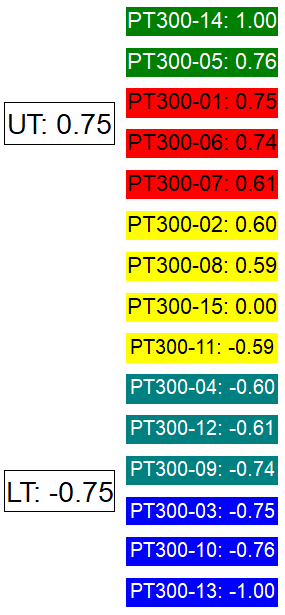
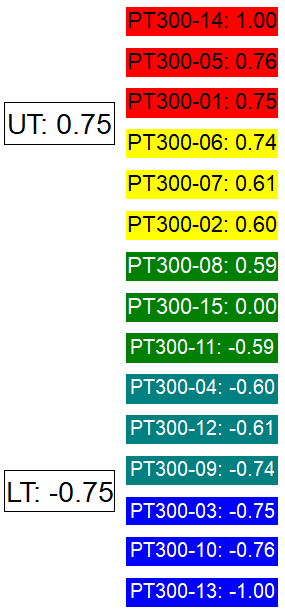
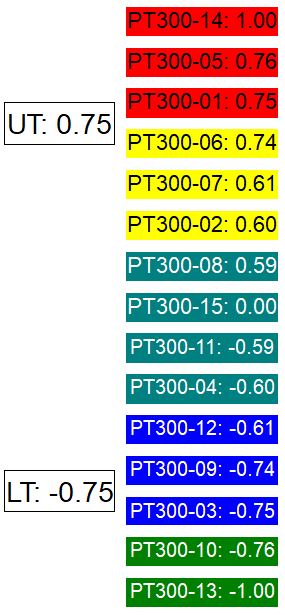
| Anchor Position | The starting point for data sorting is the Anchor Node. The options of top, center or bottom designate how the data is distributed to the Nodes. The anchor is placed above the highest value, below the lowest value or in the middle of the resolved data. This is comparable to the Position of Start Bin for CM4D Scores. Data is assigned to a Node based on the value resolved by the Node Text. The center position is most commonly used if you have both positive and negative values, where the anchor would act as a Zero bin and the values would be distributed to node/bins above and below zero. See the section Node Ordering - Anchor Positions below. |
| Nodes | Definitions of how the values are resolved and calculated as a marker. Nodes are ordered by value. The Anchor Node cannot be renamed or deleted. |
| Text | The text (variable or expression) is resolved using the data obtained from the Views' Data Source DataSet. |
| Type | Display options for the feature markers.
|
Node Ordering - Anchor Positions
Data is assigned to a Node based on the value resolved by the Node Text. The data placed in the Anchor Node is determined by the Anchor Position selected and then distributed to the other nodes according to the node boundaries.
See the following example of how the anchor position effects where data falls in the Node order, when the Nodes use upper/lower tolerance.
| Anchor Position - Top | Anchor Position - Center | Anchor Position - Bottom |
 |
 |
 |
Spectrum Node Properties
Assign a variable and/or expression in the text field and set the style to apply to the markers for the Node.
Setup Steps
To change the properties of spectrum nodes:
- In the View Annot Properties, click Spectrum.
- Enter a variable in the Text field.
For example, ~mean~ or ~dev~.
- Select a Type and Anchor Position.
- Select an available Node or create a New node.
- Click Edit to modify its properties.
- Set the Spectrum Node properties:
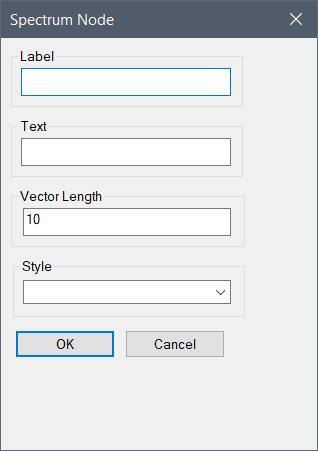
- Enter a Label.
- Enter a variable or expression in the Text field (e.g., ~ut~ or {~ut~*0.80}).
- Vector Length can be left to its default of 10, or set a different positive integer.
- Select a Style from the dropdown.
See the topic Spectrum for more details.