The Statistics tab of the DataSet Properties dialog allows you to select specific statistical controls on the selected DataSet. A DataSet automatically calculates basic statistical and summary data for each row such as mean, standard deviation, highest value, etc. See the topic DataSet Statistical Values for a complete list.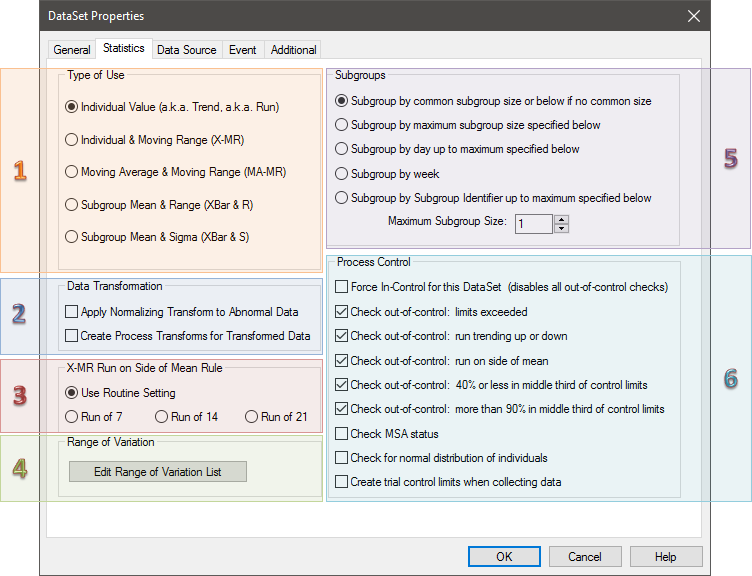
1. Type of Use
Selecting a type of use will determine how your data is calculated in the DataSet and what type of control limit will be created.
- Individual Value (Trend or Run)
- Individual & Moving Range (X-MR)
- Moving Average & Moving Range (MA-MR)
- Subgroup Mean & Range (XBar & R)
- Subgroup Mean & Sigma (XBar & S)
2. Data Transformation
The two Data Transformation options consider all of the values in the current process of a feature characteristic, not just the subset of 30 individuals or 20 subset values as in the Process Control Editor. If either of these options are selected, control limits cannot be calculated for the DataSet. Transformed data will be re-scaled so that the nominal and one of the spec limits are retained.
Apply Normalizing Transform to Abnormal Data
This option will determine an appropriate normalizing transform for all of the data in the DataSet. The transform will always be up-to-date, will only apply to the data in the context of the DataSet, and it will not be saved to the database. "Apply Normalizing Transform to Abnormal Data", is the same as the old "Apply Normalizing Transform".
Create Process Transforms for Transformed Data
This option determines an appropriate normalizing transform for all of the data in the DataSet. However, in this case, the transform is recalculated only when the option is selected on the dialog, will be saved with the features, and be applied to the data wherever those features are accessed.
3. X-MR Run on Side of Mean Rule
In an X-MR chart, when the number of consecutive points on one side of the mean meet or exceed the rule selected, the markers of the points will use the Side of Mean style in the Series dialog.
Use Routine Setting
When the radio button next to Use Routine Setting is selected, the Run on Side of Mean Rule in the Control tab of the Routine Properties dialog will be used.
Run of 7, Run of 14, or Run of 21
When the Use Routine Setting radio button is cleared and Run of 7, Run of 14, or Run of 21 is selected, the selected rule will be applied to the DataSet.
4. Range of Variation
To use the Range of Variation variables the DataSet property for range of variation tolerance percentage needs to be set. This value will default to 50 percent. CM4D will refer to this value as the ROV percent value that can be reported with the CM4D variable ~rovpercent~ and herein after referred to as ROV%. The ROV Percentage defines the size of the acceptable range of values. An ROV% value of 50 represents 50 percent of the tolerance which can be expressed in the following equation: tolerance * (50/100).
Refer to the topic DataSet Range of Variation for more information on ROV.
Edit Range of Variation List
To set the percentage values for the default ROV, or to add additional ROV% values, click Edit in the Range of Variation section on the bottom left corner of the Statistics tab. In the Range of Variation Edit dialog, you can calculate and report multiple ROV's based on different tolerances and/or percentages.
- There is no fixed limit to the number of ROV's which may be entered.
- ROV labels are case sensitive, so any upper case labels are forced to lower case to avoid problems involving case.
ROV Center Variables
~rovcenter~
~dataset,rovcenter,rov60~
~rovcenterrov40~
ROV Spread Variables
~rovspread~
~dataset,rovspread,rov60~
~rovspread,rov40~
ROV Target Variables
~rovtarget~
~dataset,rovtarget,rov60~
~rovtarget,rov40~
Variables Resolve to:
<default ROV value>
<ROV value> + label “rov60”
<ROV value> + label “rov40”
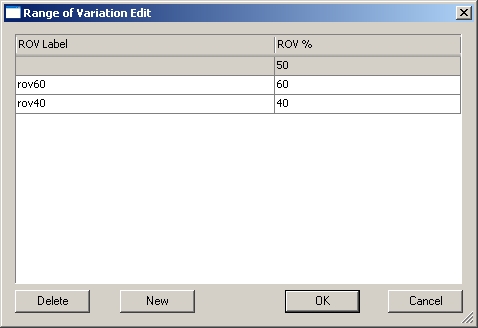
Double click the <new> label and enter your label. Double click the ROV value to enter the ROV%.
- Delete - Select the row of the ROV that you want to remove from your DataSet, and click Delete.
The default (first row) ROV cannot be deleted.
- New - Creates a new ROV.
5. Subgroups
When CM4D needs the subgroup size to use for the data, and the DataSource is a DataSet, CM4D will look at the Default Subgroup Size on all of the routines and subroutines of the query that is referenced by the DataSet.
Subgroup selection in the DataSet will override the Routine Default Subgroup settings.
For more information about subgroups, see the topic Subgroups.
Each Routine or Subroutine is assigned a Default Subgroup Size which is used when calculating statistics.
Mean is calculated as the mean value of the subgroup sample values, and range value is calculated as the difference between the maximum and minimum individual values within the subgroup.
Select one of the following settings according to the requirements of the Routine:
- Subgroup by common subgroup size or below if no common size - If the Default Subgroup Sizes for all of the Routines/Subroutines have the same value, then that common value will be used for the subgroup size. However, if the Default Subgroup Sizes of the Routines/Subroutines are not all the same value, then it uses the Maximum Subgroup Size specified below.
- Subgroup by maximum subgroup size specified below - The Maximum Subgroup Size specified below is used as the Subgroup Size for the loaded Routines/Subroutines. Any default subroup size set on the individual routines, even if all have a common value, is overridden by the maximum size specified as the maximum subgroup size.
If you have ten samples with three different creation dates (Build One, Build Two, Build Three and Build Four were created on 14-05-2016, then Build Five, Build Six, Build Seven, Build Eight and Build Nine are created on 28-05-2016, and Build Ten is created on 28-06-2016) and the Maximum Subgroup Size is set to four, then the data will be grouped into multiple subgroups of up to four, because of the specific order of the samples loaded.
- Subgroup by day up to maximum specified below - The number of subgroups depends on the unique creation dates of the samples, where each subgroup contains maximum samples of the size specified.
- Subgroup by week - Each Subgroup includes any Samples created in the same week of a year. The total number of Subgroups depends on the amount of unique weeks for the Sample creation dates. Subgroups by week do not have a maximum size or apply the Maximum Subgroup Size setting.
- Subgroup by Subgroup Identifier up to maximum specified below - The data will be divided into subgroups, each containing up to the maximum number of samples specified in the Maximum Subgroup Size field. Subgroups are based on the S_Subgroup column in the Samples database table.
- Maximum Subgroup Size - Enter a maximum subgroup size to be used if one of the subgroup options indicating "specified below" is selected and the condition requirements are met.
The minimum number of subgroups for calculating Cpk is three, and the minimum number of values needed to calculate Cpk is ten.
6. Process Control
Selecting a Process Control method in the settings of the DataSet overrides the routine settings.
- Force In-Control for this DataSet (disables all out-of-control checks) - disables all the Check out-of-control options.
- Check out-of-control: limits exceeded - is the data outside of specification limits.
- Check out-of-control: run trending up or down - is the data trending.
- Check out-of-control: run on side of mean - data meets criteria for a run on side of median (run of 7, 14 or 21) as specified by the Routine or Results Rule DataSet properties.
- Check out-of-control: 40% or less in middle third of control limits - check for out of control; 40% or less in middle third of control limits.
- Check out-of-control: more than 90% in middle third of control limits - check for out of control; more than 90% in middle third of control limits.
- Check MSA status -
- Check for normal distribution of individuals - checks to make sure that the data is normal. If the data is abnormal, neither process Cp values or run Cp values will be available.
- Create trial control limits when collecting data - see here for more information on trial limits and collecting data mode.
Check MSA status, Check for normal distribution of individuals, and Create trial control limits when collecting data are independent from the Check out-of-control options, so they are not disabled when Force In-Control is checked.