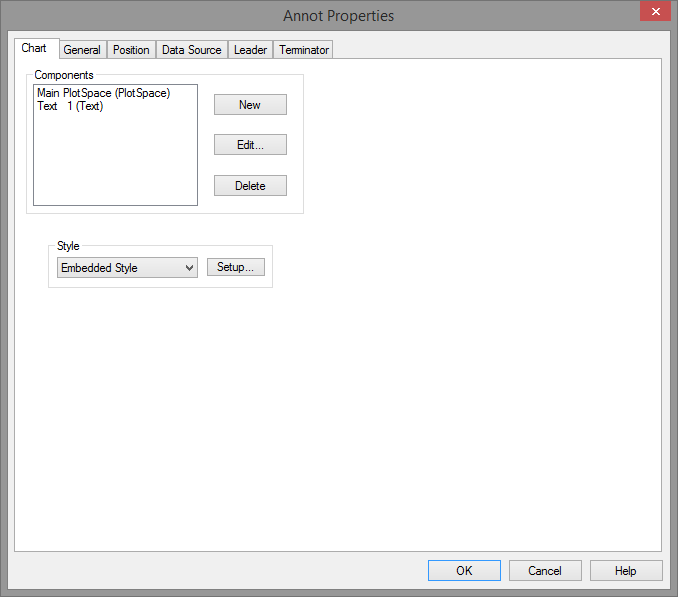
The Chart tab of the Annot Properties dialog allows you to add, edit, or delete components of a chart, as well as modify chart styles.
Charts are made up of various components, including a default Title and Main Plot Space, along with optional text, line, or shape annotation. Once you have all of the components you need within the chart, you can edit the chart to move and size the components as needed.
The above chart is a trend chart. This chart displays many of the basic components that make up a chart. Click on the title boxes for more information about each component.
The other components that can be used in a chart are lines, tables and shapes. Adding these components is explained in Editing a Chart.
The charts title is a text annotation within the chart. To alter or create the title, access the chart Annotation Properties. The chart tab will appear. Click to select Title (Text) in the Components window. Click the Edit button and type in the desired text or variable.
To edit an existing chart plot space, select the plot space in the list of components and select the Edit button. You can also add a plot space to the chart. However, this is done in the document region using the New Plot Space  tool, not within the chart property dialog. See Chart Plot Space for details on adding an additional plot space to your chart.
To add new components within a chart, select the New button from the Chart tab of the Annot Properties dialog and choose an annotation from the Select Type dialog. Text, Line, and Shape are the only annotation that can be added to a chart from the Properties dialog.
Any chart component can be modified by selecting the desired item from the Components list and clicking the Edit button. When editing a text, line, or shape component, the corresponding annotation properties dialog will appear to allow for modification in the same manner as regular annotation. For more information on editing any of these three annotation, refer to the topics Text Property, Line Property, or Shape Property.
To modify a charts background and border properties, click the Style button. See Style Properties for more information on editing an annotation's styles. Select the appropriate property page tab to edit other annotation properties.