Topic Contents: Hide
The Plot Space of a chart refers to the area within a chart annotation which contains and displays data. See the topic Chart DataSource for more information on setting up and editing your chart's DataSource.
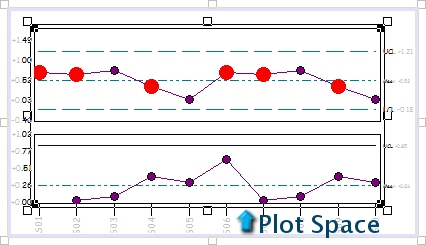
Plot space can be divided by percentage into two areas- top and bottom. The chart will automatically determine the use of the top and bottom areas by examining the chart annotation's DataSource. The DataSource for a chart must be a DataSet. There are five usage types for DataSources within a chart:
· Individual Value: When the DataSet usage associated to a chart is for individual values only, only the top plot space area will be used; the bottom area will not be used.
· X-MR: Plots individual value on top and moving range on bottom; both areas of the plot space will be used.
· MA-MR: Plots moving average on top and moving range on bottom; both areas of the plot space will be used.
· XBar & R: Plots subgroup mean on top and range on bottom; both areas of the plot space will be used.
· XBar & S: Plots subgroup mean on top and sigma on bottom; both areas of the plot space will be used.
To modify the properties of a chart Plot Space, select the Plot Space in the Components list of the Chart Annot Properties dialog and click Edit. Make the desired changes and then click OK twice to return to the sheet to view your changes.