).
).1. In
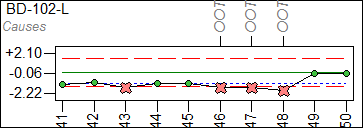
a chart which contains a point you want to assign a cause label to, move
the mouse pointer over the marker of the point. The pointer will switch
from an arrow to a cross-hair ().
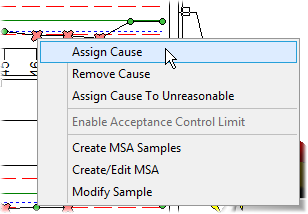
2. With the plus cross-hair over the marker, right click and select Assign Cause.
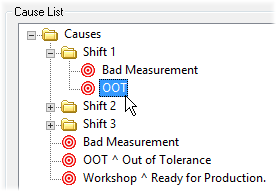
3. The Assign Cause dialog will appear.
4. Select a cause from the Cause List.
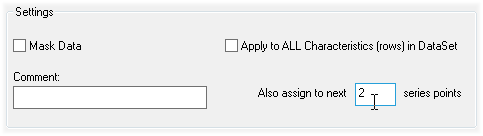
5. If you would like to mask the data, select the check box next to Mask Data.
6. If you would like to apply the cause to all of the features in the DataSet, select the check box next to Apply to all features in DataSet.
7. If you would like to apply the same cause to a number of consecutive points in the chart, enter a value in Also assign to next __ series points.
8. Click OK to assign the cause to the data and close the dialog.
9. The cause will now be assigned to the point selected. Values that have been assigned causes will display a # sign when viewed in the DataSet grid.