Scheduler Manager is the user interface used to create, monitor, and manage your scheduled jobs.
There are four tabs which make up the Scheduler Manager User Interface:
· Scheduler Monitor: contains the connection, user, and trace information for the Scheduler Service.
· Job Queue: contains the status of any Scheduled jobs and allows you to cancel any pending or failed jobs.
· Job Setup: allows you to create, edit, or removed scheduled jobs.
· Report Depository: create or modify Depositories for both Scheduler Reports and the User Depository for CM4D Web Reports.
A Scheduler Manager user is the user who runs the CM4D Scheduler Manager application interface.
Requirements:
Windows User
Access to the CM4D Database (For Windows Authentication, this user must also added as a user for the SQL database)
Scheduler Manager Site Database Privilege
A user with the Scheduler Manager privilege does not automatically have the Scheduler User privilege. If that user will also be used to run Services or Jobs, they will also need to be assigned the Scheduler User privilege.
Each tab has controls for filtering and sorting the information in the grid.
· Enter filter text here - Enter a string to filter down the entire grid to only rows containing text matching the string entered. This filtering is dynamic and will update the grid as you type.
· Drag a column header here to group by that column - See the topic Grid Controls for information on how to use the grouping and sorting options available in the Grid area.
· Columns - The available columns can be used to sort and group the results of a search.
§ Field Chooser - To access any additional or removed columns, right click in the column header area and select Field Chooser. Drag the column names into position in the column header area and close the Field Chooser dialog.
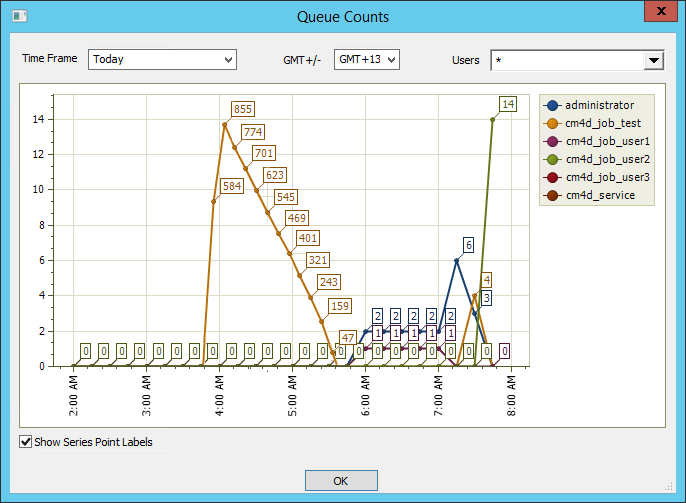
A general monitoring chart is available that allows you to get an overview of the number of jobs being run for each user in the Scheduler Queue during set periods of time.
To access this dialog, go to the Monitoring menu and select Queue Counts.

This chart will only populate with data if you have enabled Metrics and Monitoring in SiteManager.