The selected Evaluation type will be calculated on the entire DataStack.
Conformance Summary
Evaluates the conformance of the input data to the specifications defined. This evaluation can show results for the following:
Count of Conformers
Count of Valid
Count of Non-Conformers
Count of Non-Valid
Percent of Conformers
Percent of Non-Conformers
Evaluate on Current Process Only
By default, conformance is only calculated on the current process. However, in the DataStack Conformance Setup there is an additional check box that allows the evaluation to be done on all samples regardless of the baseline.
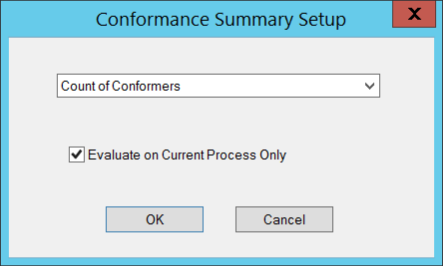
Enabled (default) – Chart will display Samples for the current process only; the correct samples with the sample labels will appear to the right of the baseline.
Disabled – Chart will display all Samples; the samples will appear to the left and right of the baseline, and show sample labels for all samples.
Check any DataSets you want to use for evaluating conformance on multiple processes to be sure that your DataStacks have the necessary input. Disabling this setting does not automatically ignore any other settings that relate to evaluation processes. For example, if a DataSet in the DataStack performing the evaluation uses the Event option “Trigger on Current Process Only” you still only see data for the current process because the DataSet that inputs the data into the DataStack only includes the current process data.
Cpk/Cpk2 Level A/B
The Cpk/Cpk2 level evaluation analyzes the DataSet(s) in the DataStack, calculates the Cpk/Cpk2 and assigns 6 Sigma levels according to the Cpk values. There are two level sets; each set applies a different range of values. See the tables below for the exact levels per set.
Refer also to the following related topics:
DataStack Evaluation - 6 Sigma Level Analysis
Process Capability and Performance Variables
Level A
|
σ Level |
Cpk Value |
|
0 |
Cpk < 0.33 |
|
1 |
Cpk >= 0.33, < 0.67 |
|
2 |
Cpk >= 0.67, < 1.00 |
|
3 |
Cpk >= 1.00, < 1.33 |
|
4 |
Cpk >=1.33, <1.67 |
|
5 |
Cpk >= 1.67, <2.00 |
|
6 |
Cpk >= 2.00 |
Level B
|
σ Level |
Cpk Value |
|
2 |
Cpk < 1.00 |
|
3 |
Cpk >= 1.00, < 1.33 |
|
4 |
Cpk >= 1.33 |
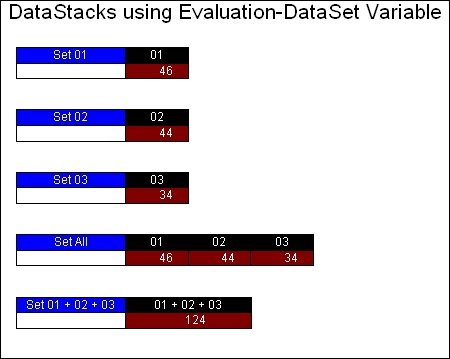
DataSet Variable
Resolves the DataSet variable entered in the Setup dialog for each DataSet in the DataStack. Each DataSet will be resolved to a single row in the DataStack, with one column containing the DataSet label and one column containing the value returned for the resolved DataSet variable.
Measurement System Analysis
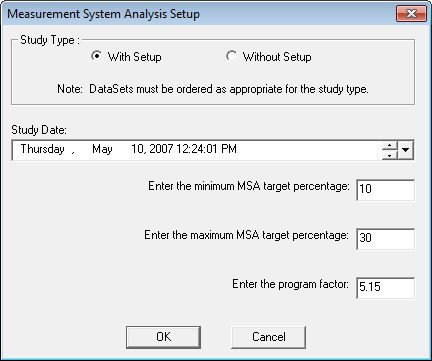
The Evaluation menu on the DataSet Properties DataSource tab is one way Measurement System Analysis Setup can be accessed. MSA Setup can also be accessed by opening the Feature Editor and double clicking the MSAs folder to open the Create or Edit MSA dialog, or by clicking the MSA button on the toolbar to open the MSA Wizard.
Miniball Analysis
See the topic Polar Charts for information on the Miniball Analysis.
Ppk/Ppk2 Level A/B
The Ppk/Ppk2 level evaluation analyzes the DataSet(s) in the DataStack, calculates the Ppk/Ppk2 and assigns 6 Sigma levels according to the Ppk values. There are two level sets; each set applies a different range of values. See the tables below for the exact levels per set.
Refer also to the following related topics:
DataStack Evaluation - 6 Sigma Level Analysis
Process Capability and Performance Variables
Level A Values
|
σ Level |
Value |
|
0 |
Ppk < 0.33 |
|
1 |
Ppk >= 0.33, < 0.67 |
|
2 |
Ppk >= 0.67, < 1.00 |
|
3 |
Ppk >= 1.00, < 1.33 |
|
4 |
Ppk >=1.33, <1.67 |
|
5 |
Ppk >= 1.67, <2.00 |
|
6 |
Ppk >= 2.00 |
Level B Values
|
σ Level |
Value |
|
2 |
Ppk < 1.00 |
|
3 |
Ppk >= 1.00, < 1.33 |
|
4 |
Ppk >= 1.33 |
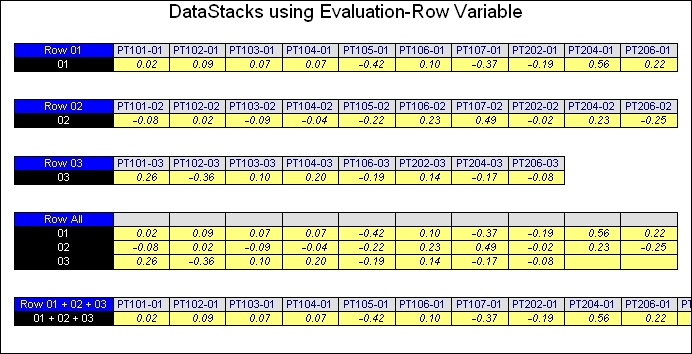
Row Variable
Resolves the variable entered in the Setup dialog for each row of every DataSet in the DataStack.
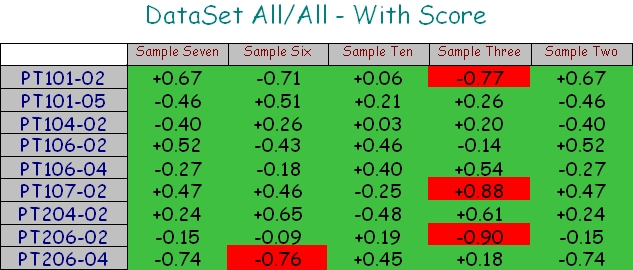
Score
Apply a Score to the DataStack. Click Setup to choose a Score. To create scores, go to the Document menu and select Document Scores.
Sift Rule Variable
This evaluation will process the defined Sift Rule variable string against all Sift Rules within the stacked DataSets.
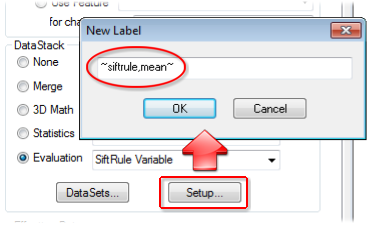
When the ~siftrule~ variable is used with this DataStack type, the first parameter (the Sift Rule Label or number) is not used.
The resulting DataStack has a row for each DataSet in the stack. The label of the row is the label of the DataSet. There will be one column for each SiftRule. If more than one DataSet is stacked, then the number of columns will be determined by the DataSet with the most SiftRules defined. The label of the column is set to the label of the SiftRule.
|
|
Surf F/A |
Surf I/O |
Surf H/L |
Hole |
Dist |
Mid |
|
MuSiRu |
-0.220 |
|
+0.114 |
|
|
-0.153 |
If more than one DataSet is stacked, the column labels will only appear if all of the Sift Rules in that column have the same Sift Rule label. If the Sift Rule labels are different, the column header will remain empty.
|
|
Surf F/A |
Surf I/O |
Surf H/L |
Hole |
Dist |
|
|
q1000 |
-0.220 |
|
+0.114 |
|
|
-0.153 |
|
Legoman |
+0.142 |
|
|
|
|
+0.087 |
|
CornerMod |
|
-0.100 |
-0.107 |
|
|
|
|
Bullet |
-0.200 |
|
|
|
|
|
Summarize by Sample Filter
This evaluation summarizes stacked data based on the Sample Filters used. The Setup for this evaluation includes one or more Sample Filters (A-Z), one Feature Filter (optional), event triggers, values based on tolerance, and sorting.
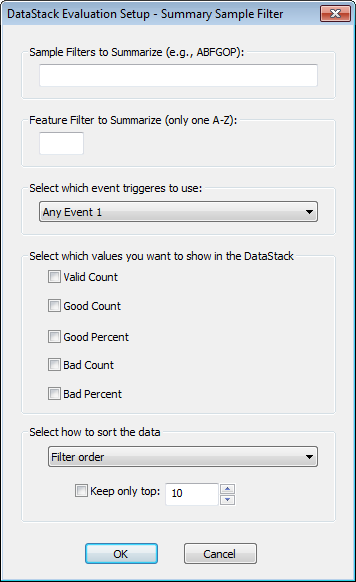
The Feature Filter is optional. If a Feature Filter is not specified, then all 'columns', or Sample Filters, are accumulated.
The Summary Sample Filter DataStack Evaluation type is intended for use with the Summary Sample Filter Report builder. See the topic Summary Sample Filter Reports for information on how to create reports that use this DataStack evaluation.
Tally
Count of how many features are within Tolerance.
Tally2
Count of how many features are with in Tolerance 2.