The Service calls tab shows information related to the performance of the service as well as methods called. The Unit Checklist Generation tab can be used to pause and resume checklist generation as well as monitor the time taken to create checklists.
Select the Service tab.
Click Data.
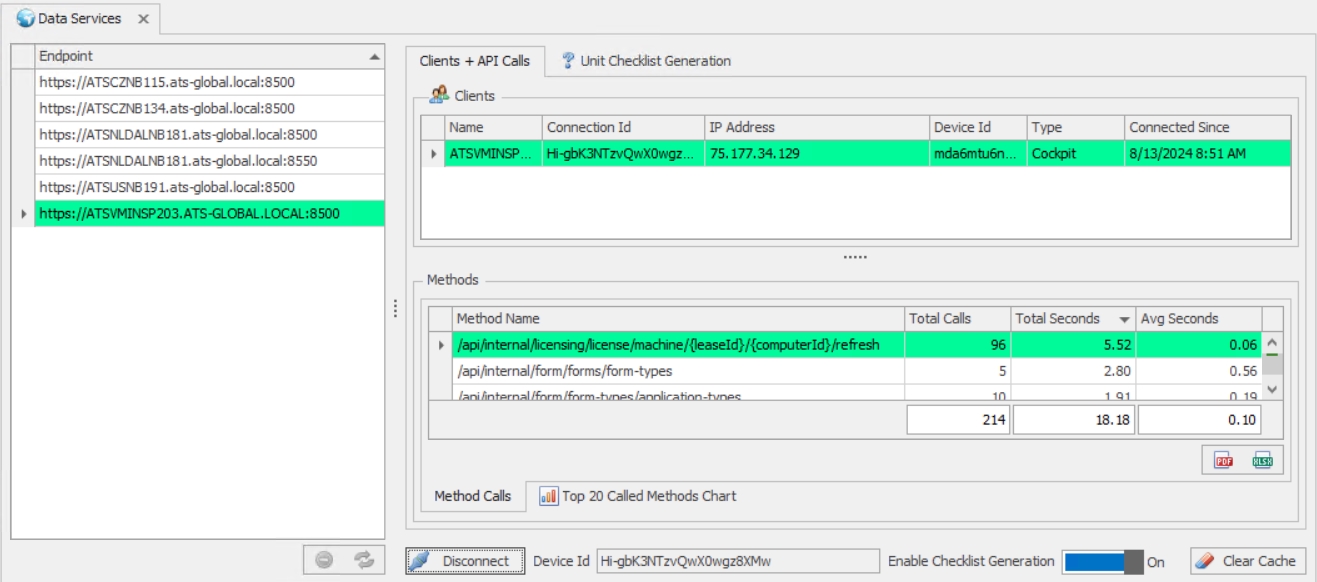
The following window opens. The left-hand pane contains a list of Data Services that can be viewed. The top-right pane lists clients and API calls that have been made on the selected Data Service. The lower-right pane lists all methods that have been called together with the number of times they've been called and the total number of seconds for which they were called.

Clients + API Calls
Select the Data Service tab.
Select the Data Service to view in the left-hand pane.
Click Connect below the lower-right pane.
The right-hand panes will begin to populate with the methods that are called.
You can click Clear Cache below the right-hand pane at any time to clear the Data Service cache.
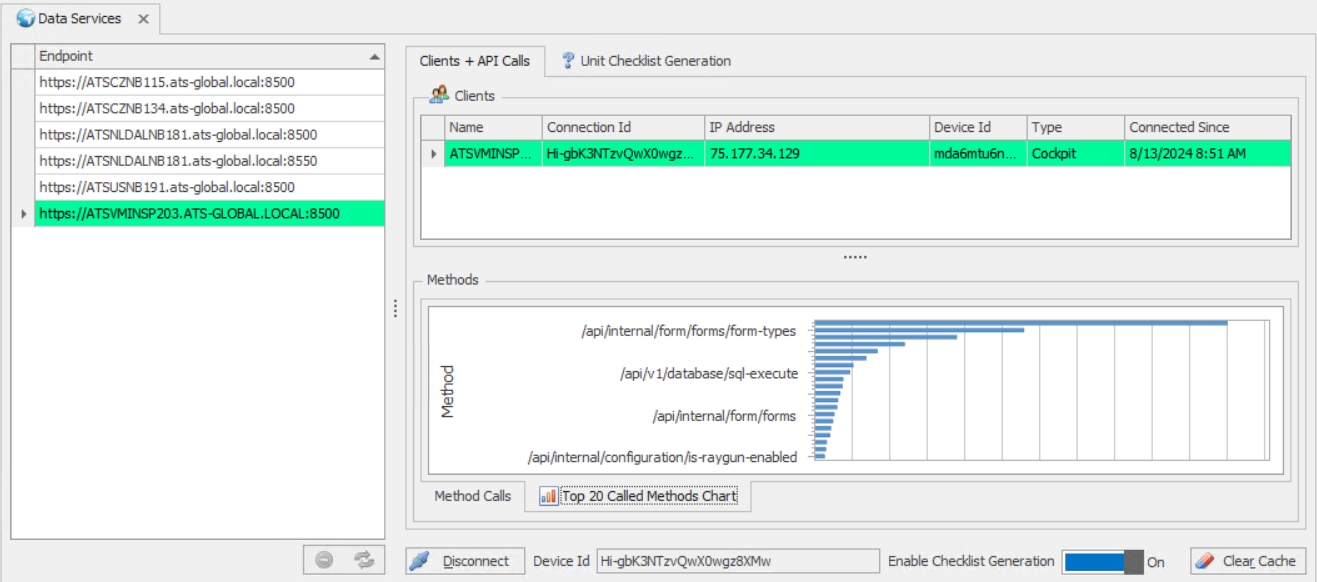
Select the Top 20 Called Methods Chart tab below the lower-right pane to view the most frequently called methods.

Checklist Generation
Select the Checklist Generation tab.
Select the Data Service tab.
Select the Data Service to view in the left-hand pane.
Click Connect below the lower-right pane.
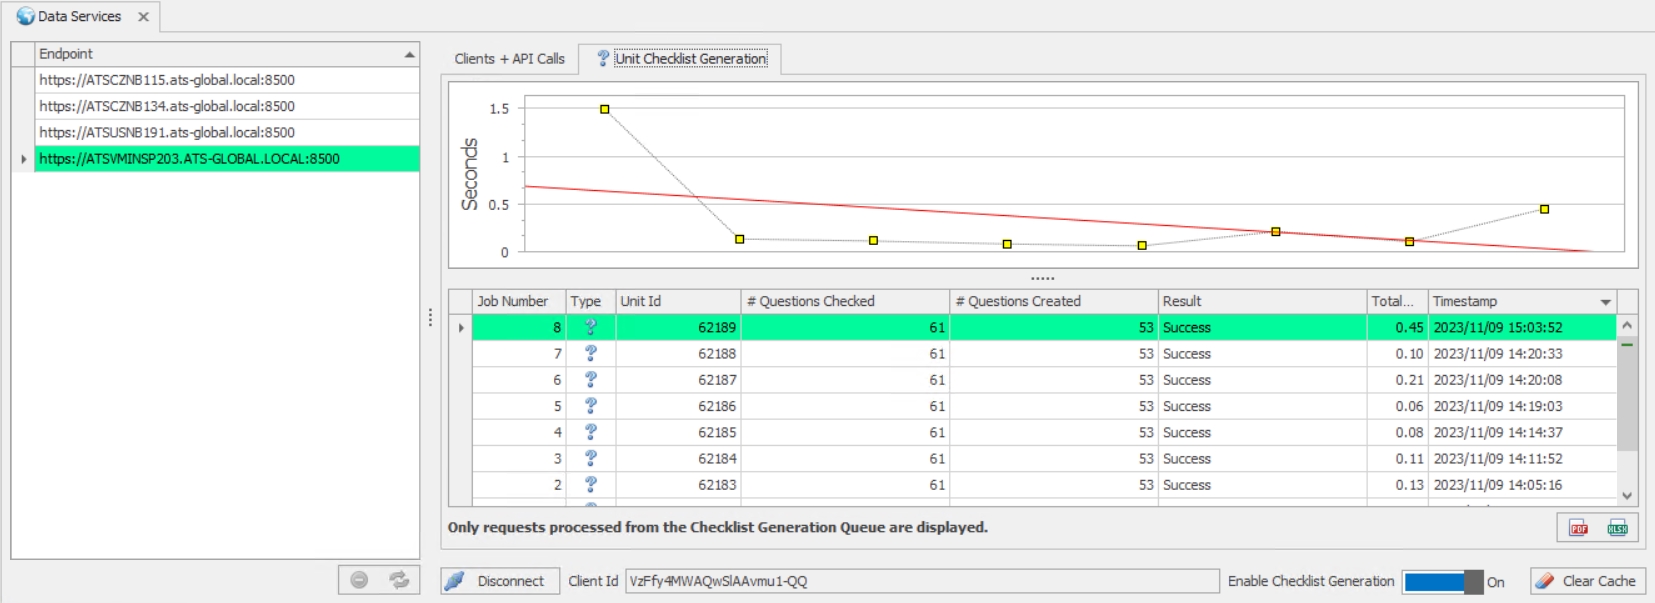
The graph will populate as checklists are generated in Data Collect in the top right pane. The bottom pane will list the units created along with the number of questions checked, the number of questions created, the result (if a single question is answered), the time taken to create the checklist and the time the checklist was generated.

The Enable Checklist Generation button can be used to pause and resume checklist generation.
The Clear Cache button will free all memory associated with caching data.
The Refresh button the list of connected applications for the traffic server.