Topic Contents: Hide
In the Chart Plot Space dialog, selecting the Lines button allows you to add or modify chart lines. There are many different types of lines that you can add to your chart. Each line type has Style properties such as color, thickness, and pen style. You can edit chart lines, making them a different color or dashed, for example. Changing the style of lines can help to differentiate between multiple lines in a chart.
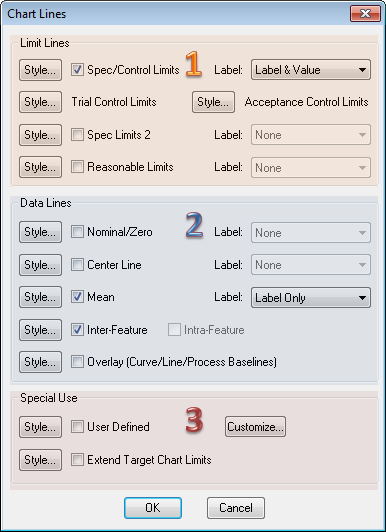
Click on the image below to learn more about the various sections of this dialog.
The Spec/Control Limits, Trial Control Limits, Spec Limits 2, Reasonable Limits, Nominal/Zero, Center Line and Mean lines can display their labels and values to the right of the chart plot space. To display the label of the line, select Label Only from the Label menu. To display the label and the value of the line, select Label & Value from the Label menu.
The first section of the Chart Lines dialog contains settings for displaying lines across the plot space related to Out-of-Tolerance/Control limits.
Styles for Chart or Graph plot space lines have been enhanced to allow you to alter the appearance of the space between limit lines. The Brush style can help you to identify the Spec Limits of the chart at a glance. Instead of only having only lines to indicate Limits, you can apply a brush style that fills the space between the lines (or, in the case of unilateral spec limits, from the line to the edge of the plot space, in the direction of the data).
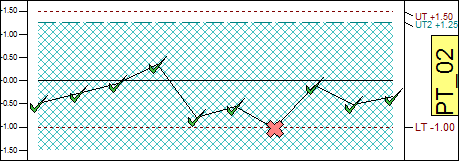
You can also apply a Hatch pattern to the brush color to achieve a sort of “transparent” color (in the image above, Light Teal Hatch – Diagonal Cross was used). The Brush style can be applied for any of the Limit Lines, as well as User-Defined Lines.
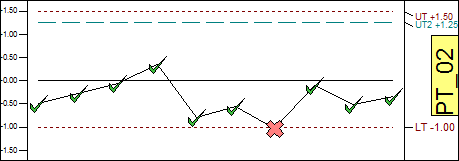
This line is displayed at the spec/control limit value. Control limit lines are displayed in control charts. Other types of charts may use spec limit lines.
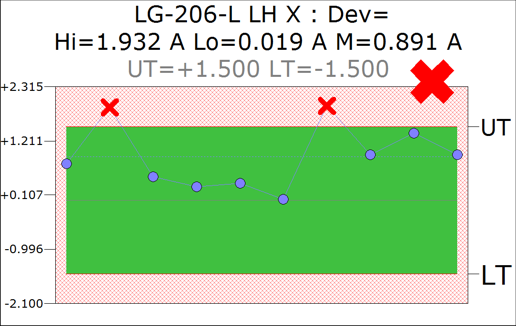
In the example below, a Trend Chart has been configured to appear green in between the Upper and Lower Spec Limit (or Tolerance) lines. This is achieved by assigning a Brush color to the Spec Limit lines in the Main Plot Space properties.
This line is displayed at the trial Control Limit Value. See the topic Trial Control Limits for more information.
This line is displayed at the Acceptance Control Limit value. See the topic Process Control Limits for more information.
This line will be displayed at the limit 2 value. You could show both sets of limits, regular limits and limit 2 limits, in a chart. This can be especially useful when creating a target chart.
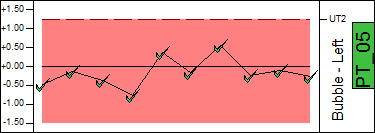
In the image below, Spec Limit 2 (a Unilateral Tolerance) is indicated by the light maroon in the background (Brush) and the maroon dashed line (Pen style). The brush color ends at the margin of the plot space.
Selecting the check box next to Reasonable Limits will display the Reasonable Limits lines.
The second section of the Chart Lines dialog contains settings for displaying lines across the plot space related to data.
This places a line at the point representing nominal point of the charted feature.
This places a line at the process mean.
This places a line at the mean point of the plotted values.
This places a line connecting the series of points plotted on your chart.
This places a line that appears as a bell curve on a histogram, a middle line on a normal probability chart, or a vertical dividing line between process baselines.
The third section of the Chart Lines dialog contains settings for displaying lines across the plot space related to the special use options.
This allows you to place one or more lines at any point across the chart that you define.
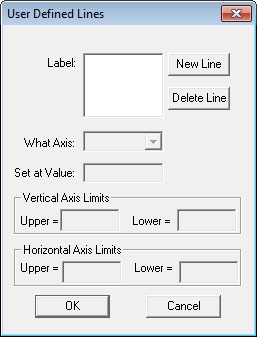
· Label - To create a new line, click the New Line button, enter a label in the User Defined Lines dialog box and click OK. To delete a line, select the line you want deleted and click the Delete Line button.
· What Axis - Select the axis for which this line will appear: ellipse, horizontal, or vertical.
· Set at Value - For a horizontal or vertical line, enter the value at which the line will appear.
· Vertical Axis Limits - For an ellipse, you will enter four points to determine the size and placement of the ellipse. The first two are the vertical limits, the upper limit will determine the top of your ellipse, and the lower limit will determine the bottom of your ellipse.
· Horizontal Axis Limits - The other two points you will enter for an ellipse are the horizontal limits. The upper limit will determine the right side of your ellipse and the lower limit will determine the left side of your ellipse.
For User-Defined lines, a brush style will only be applied when there are exactly two (2) User-Defined lines. If there are more or less than 2 lines, the Brush property will not be applied.
This extends the limits in a Target Chart from the edge of the target line to the edges of the chart, allowing it to meet the scale values on the axis lines.